Getting Started
The GameBench Web Dashboard is an essential tool for storing, visualising and comparing test sessions. Although some degree of analysis is possible on the GameBench Android and desktop applications, we recommend that you use the Web Dashboard for all analysis of your test data.
Logging in
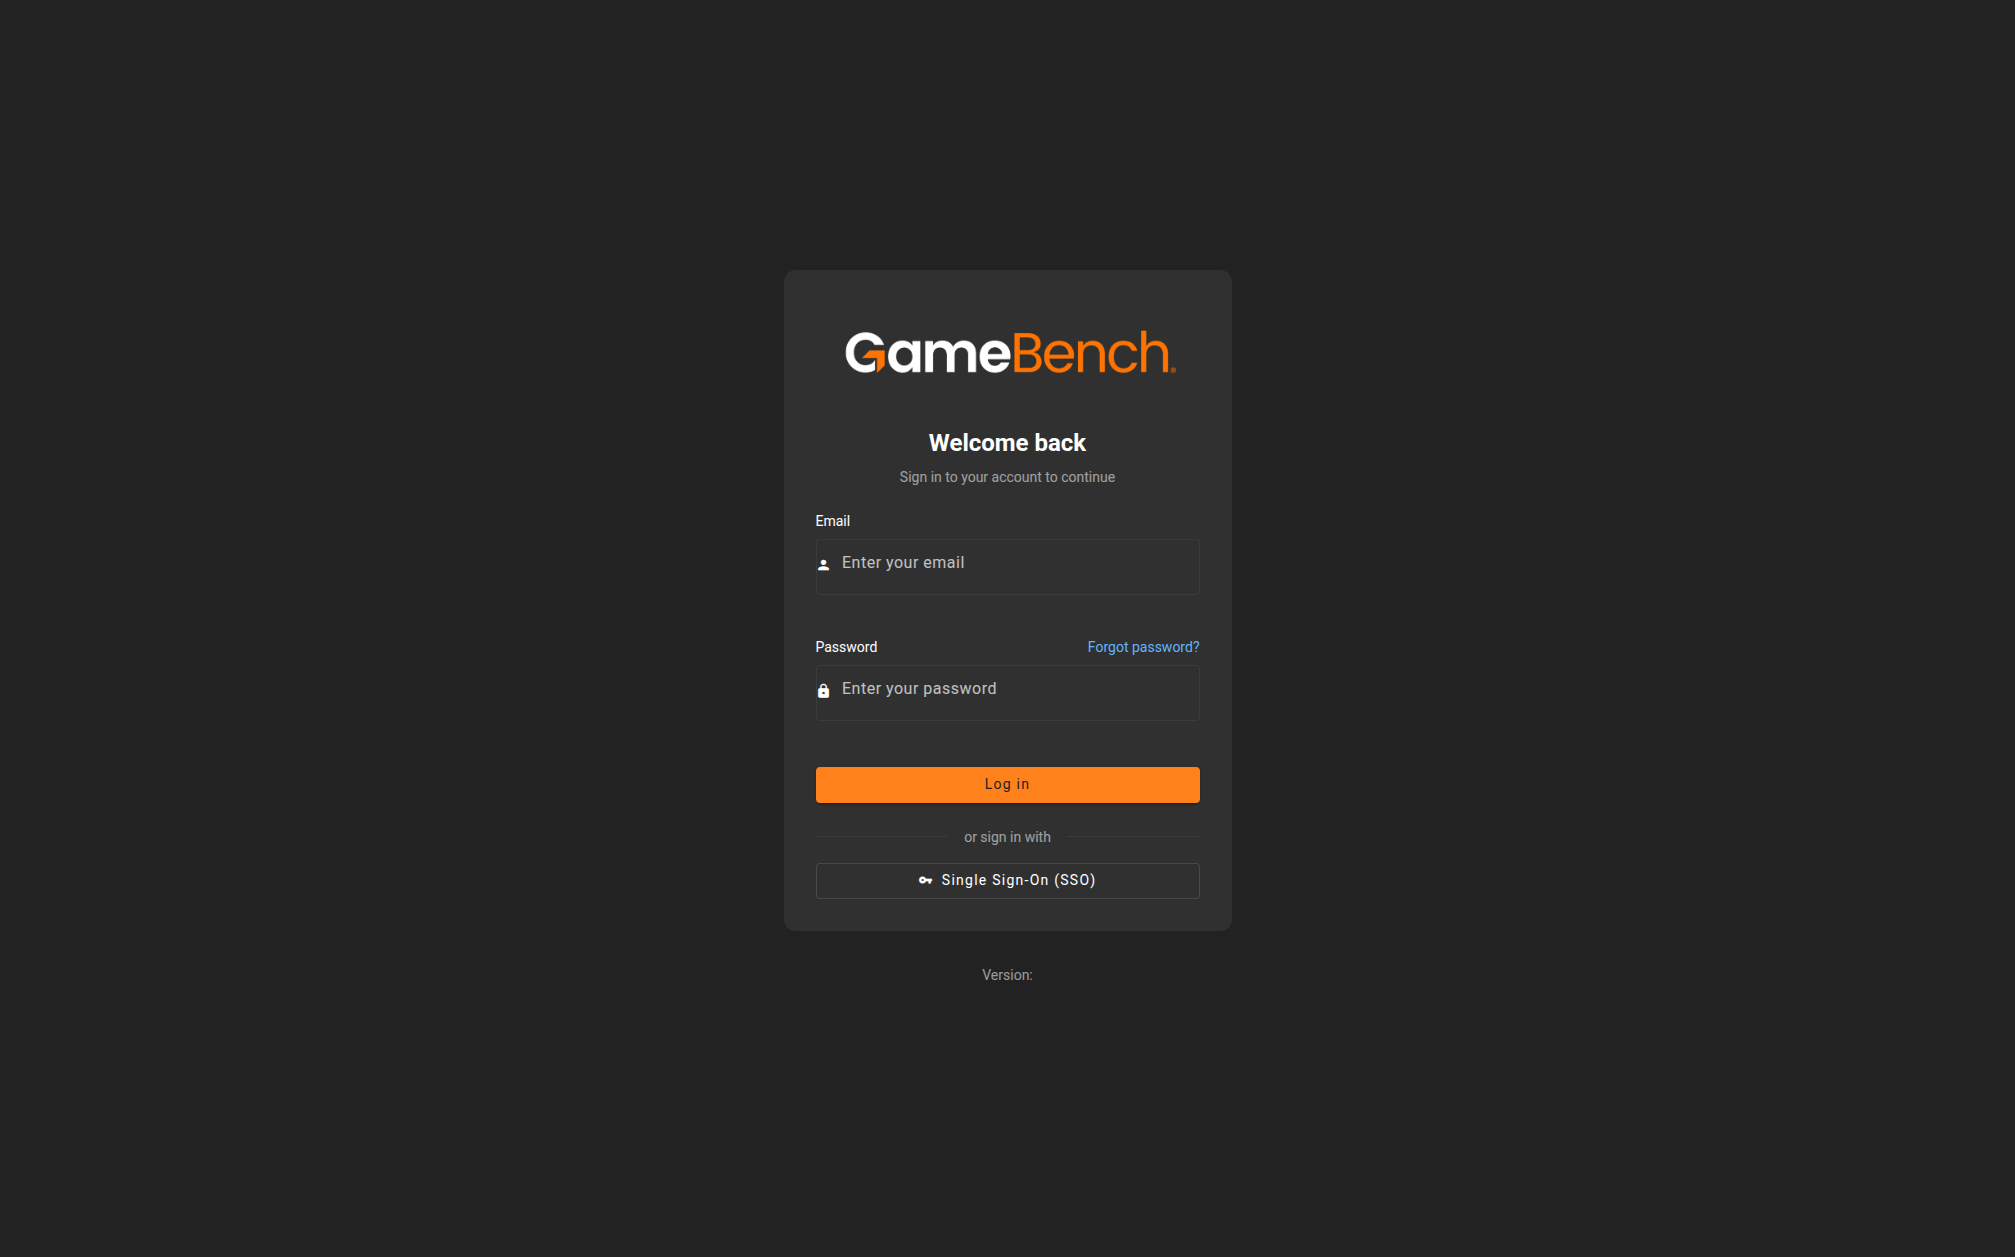
To access the Web Dashboard, most users simply need to enter their username and password at web.gamebench.net.
Premium users whose company has purchased a GameBench Private Server will need to login at the private URL provided to them by their IT administrator.
Users can also sign in using Single Sign-On (SSO) if their company has configured it. See SSO Configuration for setup details.
Navigating the Dashboard
After logging in, you’ll arrive at the Dashboard Home, which provides an overview of your active collection and quick access to GameBench tools.
The main navigation bar at the top of the screen gives you access to:
- Dashboard – Your home page with collection summary, detected issues, and lenses.
- Trends – Track performance metrics across builds.
- Sessions – Browse and filter all test sessions.
- More menu:
The user menu (top right) provides access to:
- My Company – Manage company settings, users, licenses, integrations, and SSO.
- My Account – Manage your profile, API tokens, usage, and collections.
- Import – Import session data.
- Downloads – Download GameBench tools (Performance Injector, Studio Pro, SDK).
Collections
Your data is organised into collections. Use the collection selector in the top navigation bar to switch between collections. The active collection determines which sessions, apps, and devices are displayed.
Viewing Session Details
To analyse a test session, go to the Sessions page, find the session you’re interested in, and click on it to open the session detail view. The session detail view includes a scorecard with key metrics and detailed panes for FPS, power, CPU, GPU, memory, network, and markers.