CPU
What is CPU Load?
CPU load is a key performance metric. It can be used to track CPU performance regressions or improvements, and it is a useful data point for performance problem investigations. CPU load measures the amount of work done by a CPU between two sampling intervals. A high reading means your CPU is more utilised during that period. Modern devices have multi-core CPUs that can operate at different frequencies depending on the computational need of the software using the CPU. As a result, a CPU that’s fully loaded at a lower frequency can still accept more jobs from the operating system if the frequency is increased.
A key observation to make is the fact that CPU Load depends on the operating point of the CPU. A CPU that’s 100% loaded at 500 Mhz will only be 50% loaded if the frequency is increased to 1GHz. So there is a need to normalise the CPU Load to the maximum operating frequency of the CPU.
What is Normalised CPU Usage?
GameBench reports normalised CPU Usage for the profiled app in Android. To understand normalised CPU Usage please look at the following example.
Let’s consider the following scenario on a device that has a Quad-Core CPU
- CPU Load because of the app - 50%
- Number of cores that are online - 2 out of 4
- Maximum Operating point of the CPU Cores - 1 GHz
- Operating points of the two cores that were on - 500 MHz
The normalised CPU Usage is calculated as follows,
- Maximum Available CPU Cycles - 4 * 1 GHz - 4 Ghz
- Available CPU Cycles when app was running - 500 Mhz * 2 = 1 GHz
- Percentage of Total CPU Cycles Available during sampling - 1Ghz/4Ghz = 25% or 0.25
- Normalized CPU Usage - 50% * (0.25) = 12.5%
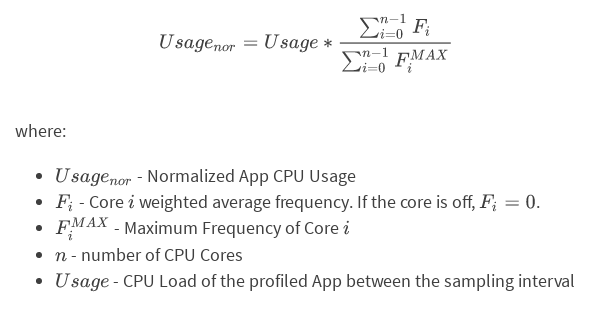
This can also be expressed as the following formula,

Note: Information regarding the frequencies of the CPU cores is not exposed on iOS devices. Without this information, it is not possible to calculate normalised usage.
What is collected?
iOS
On iOS devices, GameBench collects CPU load twice every second and the load is reported per core (for e.g.: a dual core device can have a maximum CPU Load of 200%).

Android
On Android devices, CPU load is measured (once every 200 ms) and converted to normalised CPU usage. In addition to the load, GameBench also collects the CPU core states (in a multi-core system, this information can be used to identify the cores that were online and offline), CPU core current frequencies and threads usage.
GameBench measures how the CPU usage for the app breaks down into threads usage. The reported threads usage is not normalised as it is relative to the monitored app’s CPU usage. If the profiled app uses 30% of CPU during an interval, the percentage reported for a thread is relative to that 30%.
What is displayed?
iOS
CPU Load Chart
The CPU Load of the app and system are both displayed in the charts as shown below. As you may notice, the values range from 0 - 200% as this is a dual-core device.

Android
Normalised CPU Usage
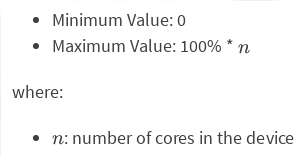
Normalised CPU Usage is charted for Android devices for both the app and the system. This number ranges from 0 - 100% as its normalised for the number of cores and the maximum possible operating frequency of the CPU.
CPU Core States
This chart is helpful in multi-core devices to understand which cores were online. In the example below, we can see that this device contains an octa-core CPU and 4 of the 8 cores (1-4) kept switching on and off for most of the duration.

Threads Usage
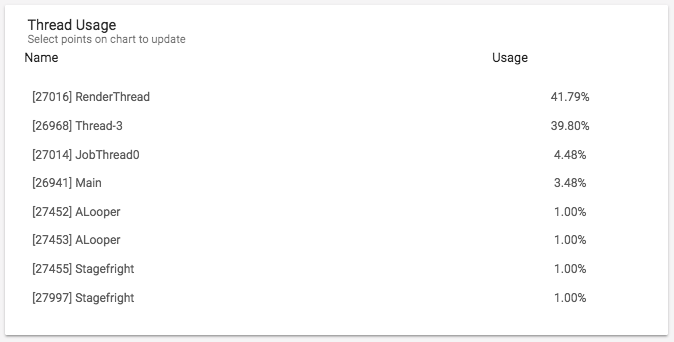
Threads usage is reported for the top 8 threads ordered by CPU Usage. The user can click on various points of the CPU usage chart to understand how the usage was split between different threads in the app. In the following example, it is possible to see that a thread named “RenderThread” contributed to 41.79% of the app’s CPU usage.

CPU Core Frequencies
This chart shows the actual frequencies of the various CPU Cores in the device. The following chart shows that cores 1 and 2 were off for most of the duration shown.

What should you look for?
iOS
Sustained values of high CPU Load need to be looked at more carefully (Understand what was happening on screen using the screenshots for context) as this will most likely lead to increased battery drain. Because of the way modern CPU’s work, an increase in CPU load will usually trigger the CPU to go into the next higher operating frequency. The transition to the next operating point should result in a lower CPU load value. If an application is consistently loading the CPU, the OS continues to increase the operating point until it reaches the maximum value. This is definitely not desirable behaviour and should be investigated.
Short bursts of high CPU Load are fine.
Android
This depends on the number of cores in the device used for testing. On a quad core system, a value greater than 25% would mean that one core has been fully utilised for the application and as a result would be considered high CPU Usage although this is fine in short bursts. Consistent CPU Usage > 25% definitely needs further investigation.
All the threads used in the app should be “named” in order to use the information provided in the best possible way. It’s always a good idea to check if any of the “light” threads are unexpectedly consuming more CPU Cycles.
How is it measured?
iOS - CPU Load is measured using the Activity Monitor Instrument.
Android - CPU Usage is measured using the data provided by the standard proc filesystem. The proc file system is used by utilities such as top to measure the CPU Load of a running application.