Sessions
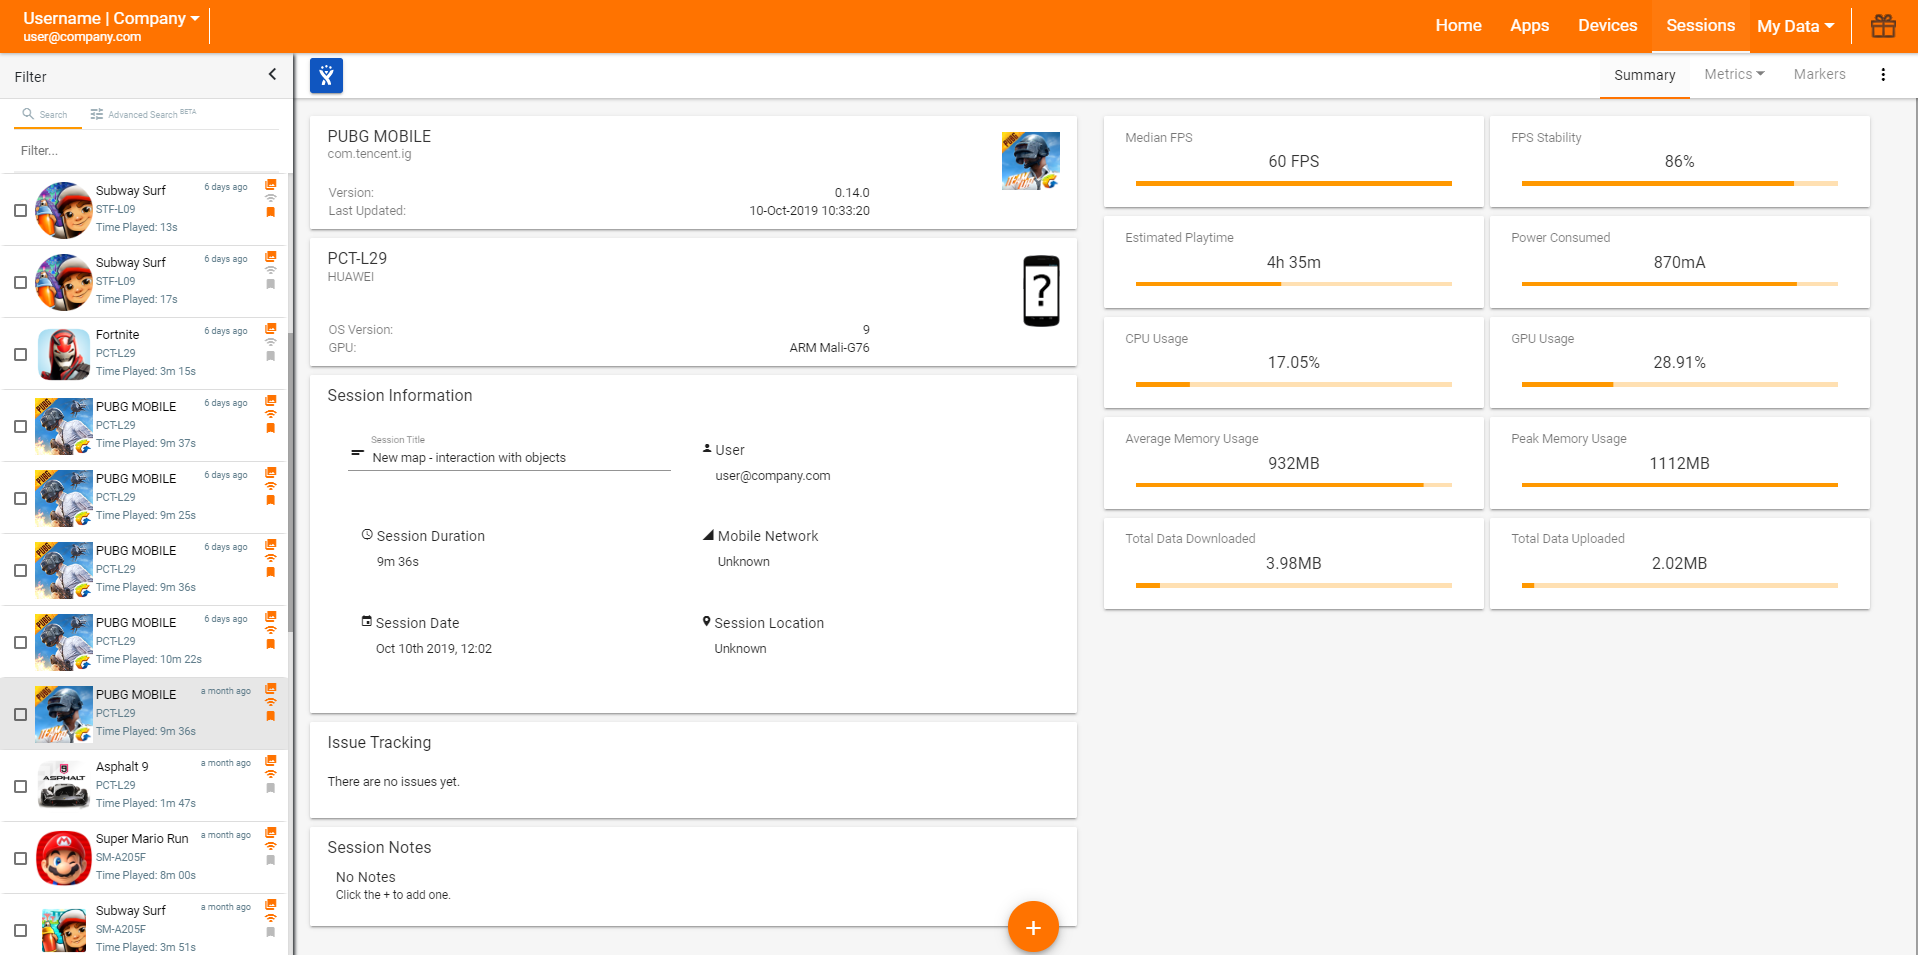
When a test session is synced to your GameBench Web Dashboard, you’ll see it appear in your Recent Sessions list, where you can click the session to reveal its Summary pane. This article will explain the contents of the Summary Pane, including the grid of ten small boxes that make up the GameBench scorecard.

Note: All ten metrics included in the scorecard can be clicked on to reveal charts and more detailed information. This deeper level of analysis is discussed separately in a series of articles:
- Analysing Frame Rates
- Analysing Power Consumption
- Analysing Resource Usage
Session Details box

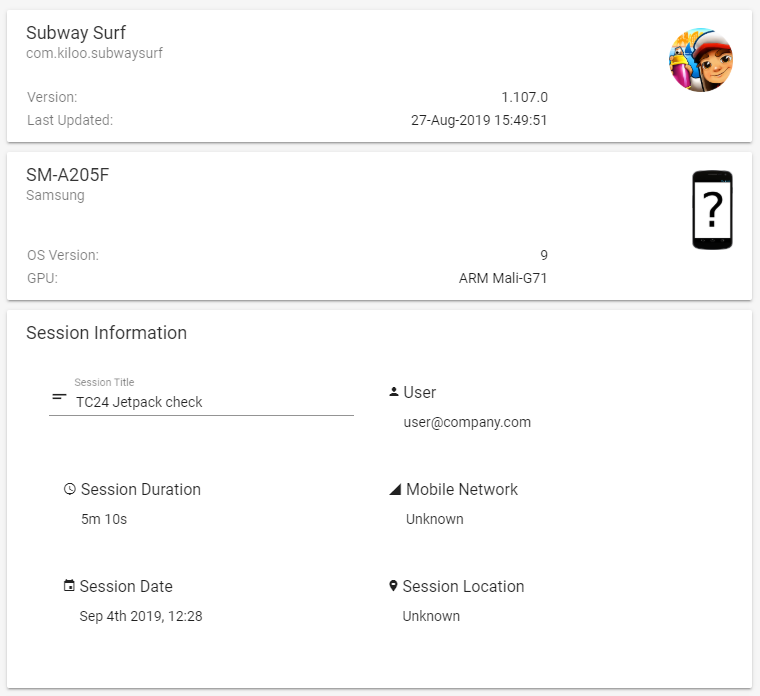
The top-left box on the Summary pane shows basic details of your session. For the device, this covers the model name (which will not always coincide with a device’s marketed brand name - for example, the Galaxy S7 Edge is the SM-G935F), Android version, chipset details, and serial number. For the app, the description covers the app name, package name, version number and date of the last update.
Below these details, you’ll find the session duration, date and time of collection, and the email address associated with the user account which submitted the session.
If you execute particular test cases or verify specific scenarios during session recording, you can title each session by adding test case names or numbers, scenarios names, ticket numbers and etc. into the Session Title field. If you’re looking for specific test-cases executed in several sessions and compare their performance, you can find them using the Advanced Search feature.
Session Notes box

This box shows user-created notes that have been added to the session. You can easily add a note, or additional notes, by clicking the orange “+” button in the Session Notes box and then clicking “Save” when your note is complete.
Adding notes is a good habit to get into, for example, to record subjective impressions to go along with the objective metrics collected by GameBench, or to record certain device settings (for example, whether the device was in some sort of battery-saving mode).
Frame Rate scores

Better graphics tend to make a game or app more engaging, but they also increase the risk that visuals will appear stuttery or unresponsive. For this reason, the top two summary metrics on the Scorecard are both concerned with visual smoothness. This smoothness is measured objectively by means of the frame rate, which is the speed with which the device was able to render new frames of the game and thus create fluid animation.
The first score shows Median Frames Per Second, which is the most common frame rate observed during the session. For games, a higher median FPS is generally better, up to a maximum of 60fps (which is the refresh rate of most – but not all – mobile display hardware).
The second score shows FPS Stability, which is the proportion of the session time that was spent within +/- 20 percent of the median FPS. A higher percentage is generally better, because it means that the user experienced a narrower range of frame rates and therefore is likely to have had a more consistent visual experience.
Note: These frame rate summary scores are more tailored for game testing. If you’re testing an app, it’s better to ignore these metrics and instead jump straight into a more detailed article: How to Assess Frame Rates.
Power Consumption

Users tend to abandon games and apps that are suspected of causing excessive battery drain, which means that power consumption is an essential component of any UX test. Wherever possible, GameBench captures two different types of power consumption metric, which are summarised separately on the Summary pane: Estimated Playtime on the left and Power Consumed (mA) on the right.
Estimated Playtime is derived from battery depletion data as reported by the device-under-test’s operating system. It’s a prediction of how long a device would last if it played the app-under-test constantly, starting out with a fully charged battery – so the longer this duration, the more power efficient the app-under-test. The longer the test session, the more reliable this estimate, and any estimates based on sessions of less than 15 minutes duration may not always reliable.
Power Consumed is derived direct from Snapdragon and Exynos chipsets, which report total system power consumption in the form of more reliable, “instantaneous” power readings. The metric shows the amount of power (in milliamps) consumed during the session, so it depends on two things: the power appetite of the device-under-test while playing the app-under-test, as well as the session duration. When session duration is a fixed variable (e.g., because all your tests are exactly 15 minutes long), a lower figure for Power Usage (mA) equates to a more power efficient app.
Note: These summary power metrics either will not be filled in, or will be filled in but inaccurate, if the device-under-test was charging during the test.
CPU Usage / Load

On Android devices, CPU Usage reflects the degree to which the app-under-test taxed the device’s main processor (CPU). High CPU Usage can often reflect poor optimisation, and if left unsolved it can lead to excessive power drain, temperature increases, throttling and reduced performance. For some developers, a CPU Usage reading higher than 10-15 percent during normal use of a game or app can be cause for concern.
The CPU Usage metric shown on the Summary Pane is the average CPU usage of the foreground app (not background processes) across the duration of the session. This is expressed as a percentage of maximum CPU capacity. Thanks to the way Android chipsets report their behaviour, this metric is quite intuitive: A reading of 50 percent means that, on average, half of the total CPU capacity remains unused during the session, whereas a reading of 100 percent means that the CPU was entirely maxed out across the whole session. A lower percentage is therefore better.
On iOS devices, GameBench reports Apple’s own metric “CPU Load” rather than “CPU Usage.” This metric can still generally be read in the same way as “CPU Usage” on Android, with a higher percentage generally equating to more stress on the CPU. However, it’s safer to compare this metric across iOS test sessions rather than use it to compare iOS versus Android CPU behaviour. This is because, unlike Android, Apple’s operating system doesn’t take the number of CPU cores or their clock speeds into account when reporting CPU Load. This also means that CPU Load can be up to 200% on dual-core Apple devices (or quad-core devices where pairs of cores operate simultaneously). See more at: Analysing CPU Data
GPU Load

It often happens that an app or a game will tax the graphics processor (GPU) in a mobile device to a greater extent than it taxes the central processor (CPU). This makes GPU Load an important metric when looking for performance bottlenecks.
GPU Load is an unnormalised metric, which means it is the percentage of available GPU capacity that is being used at any given moment, rather than the percentage of total GPU capacity. Available GPU capacity can be lower than total GPU capacity if the GPU is running below its maximum clock frequency, which means that a high GPU Load doesn’t necessarily mean the GPU is being maxed out – it might still have some headroom to increase its clockspeed. Then again, sustained bouts of higher GPU Load (e.g. more than a few seconds long) do tend to reflect higher GPU stress, and prolonged incidents of very high GPU Load (e.g. above 80 percent) can lead to a performance bottleneck – which means the average GPU Load reported on the Summary pane is a useful indicator of excessive stress on the GPU.
Memory Usage

A game or app with a high memory footprint is more liable to crash or be shut down by the operating system, especially if other, background tasks leave the available memory in short supply. What’s more, a game or app that shows steadily increasing Memory Usage across session duration may be suffering from a memory leak.
To help you spot memory problems quickly, the Summary pane reports two metrics: Average Memory Usage and Peak Memory Usage. The former describes the average RAM footprint across the session, while the latter represents that highest observed footprint. In both cases, a lower figure generally reflects better optimisation. If there is a very big gap between the Average and Peak readings, then it’s possible that there is a memory leak, since in general, we’d expect an app’s memory footprint to be quite steady across the session duration.
Network Traffic

Users with limited data plans are increasingly wary of apps and games that generate large amounts of network traffic. In addition, excessive network activity can be associated with slow-downs (including increased wait times) and increase power usage. For this reason, lower figures in both the Total Data Downloaded and Total Data Uploaded boxes on the Summary pane are generally better.