Getting Started
The GameBench Web Dashboard is an essential tool for storing, visualising and comparing test sessions. Although some degree of analysis is possible on the GameBench Android and desktop applications, we recommend that you use the Web Dashboard for all analysis of your test data.
Below you’ll find instructions on how to log in and navigate the Web Dashboard. If you’re looking for help with analysing test sessions, then please progress on to the next article: The Sessions Pane
Logging in
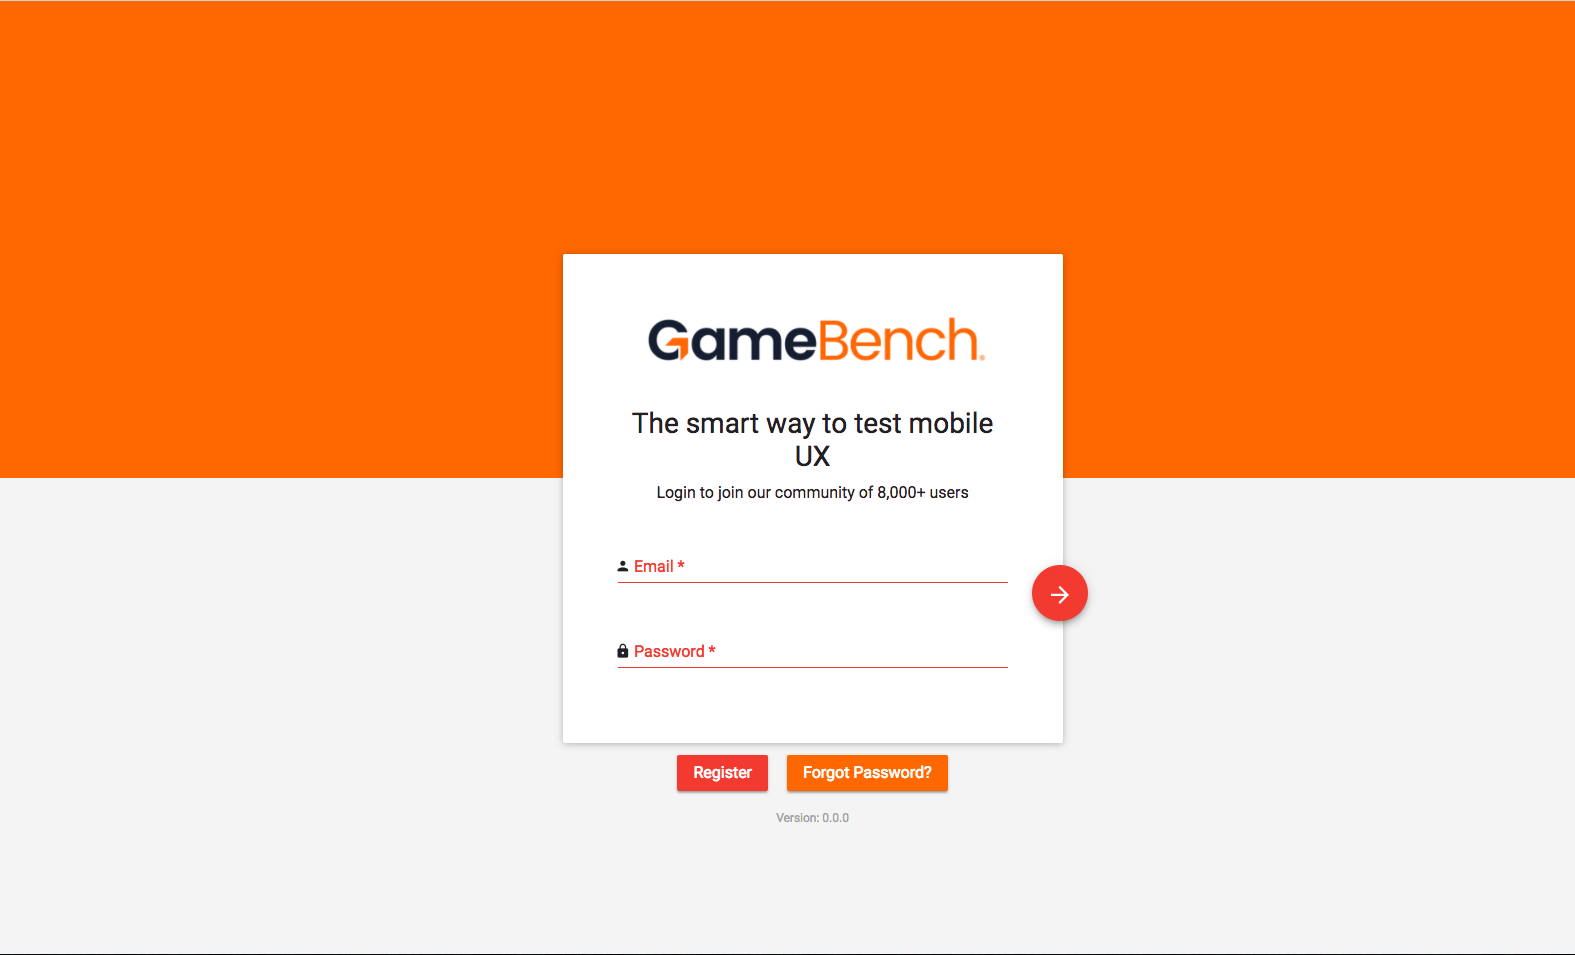
To access the Web Dashboard, most users simply need to enter their username and password at web.gamebench.net.
Premium users whose company has purchased a GameBench Private Server will need to login at the private URL provided to them by their IT administrator.
The Home Tab
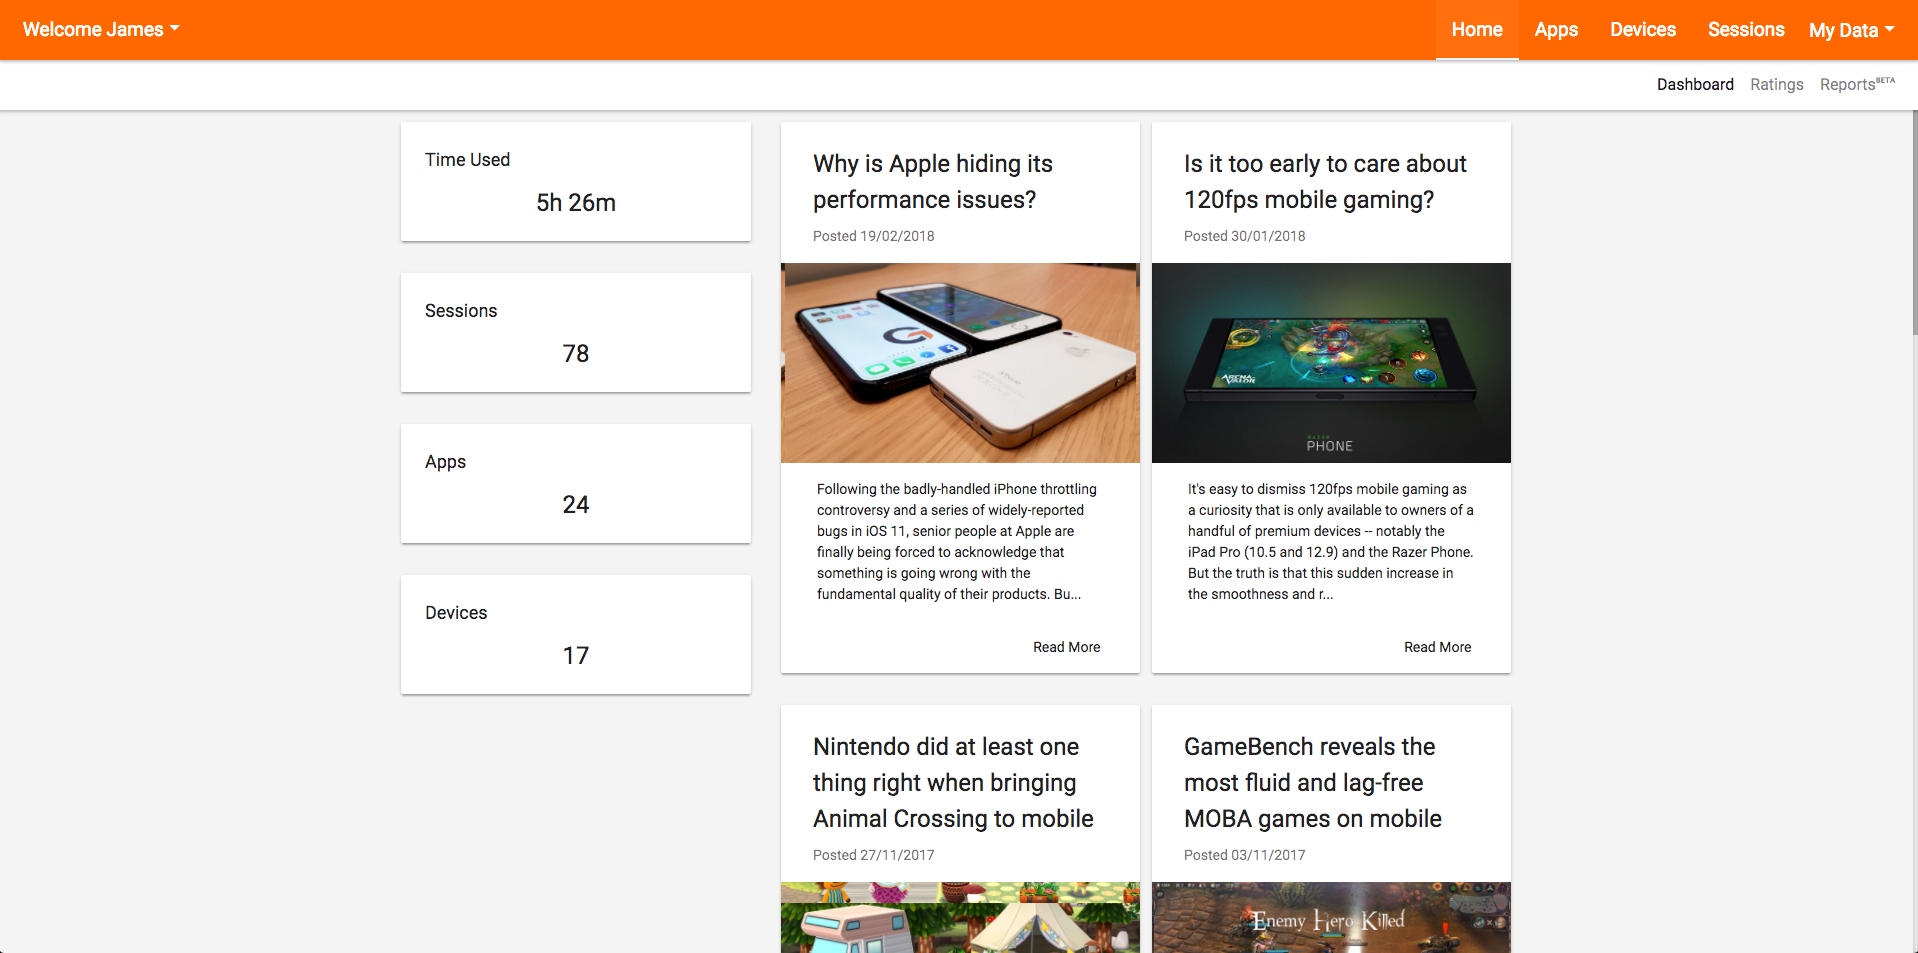
After logging in, you’ll arrive at the Home tab, which contains a number of boxes and tabs that are designed to help you work quickly.
The Time Used box shows you much session time you (or your team, if you’re a Premium user) have generated so far.
The Sessions box shows you the total number of sessions you have recorded.
The Apps box shows you the number of top apps you’ve tested, based on median frame rates across all sessions.
The Devices box shows you many different device models you’ve tested.
The Blog boxes contain recent GameBench articles. These are worth a look as they might provide hints and tips that assist with your own testing.
The Apps Tab
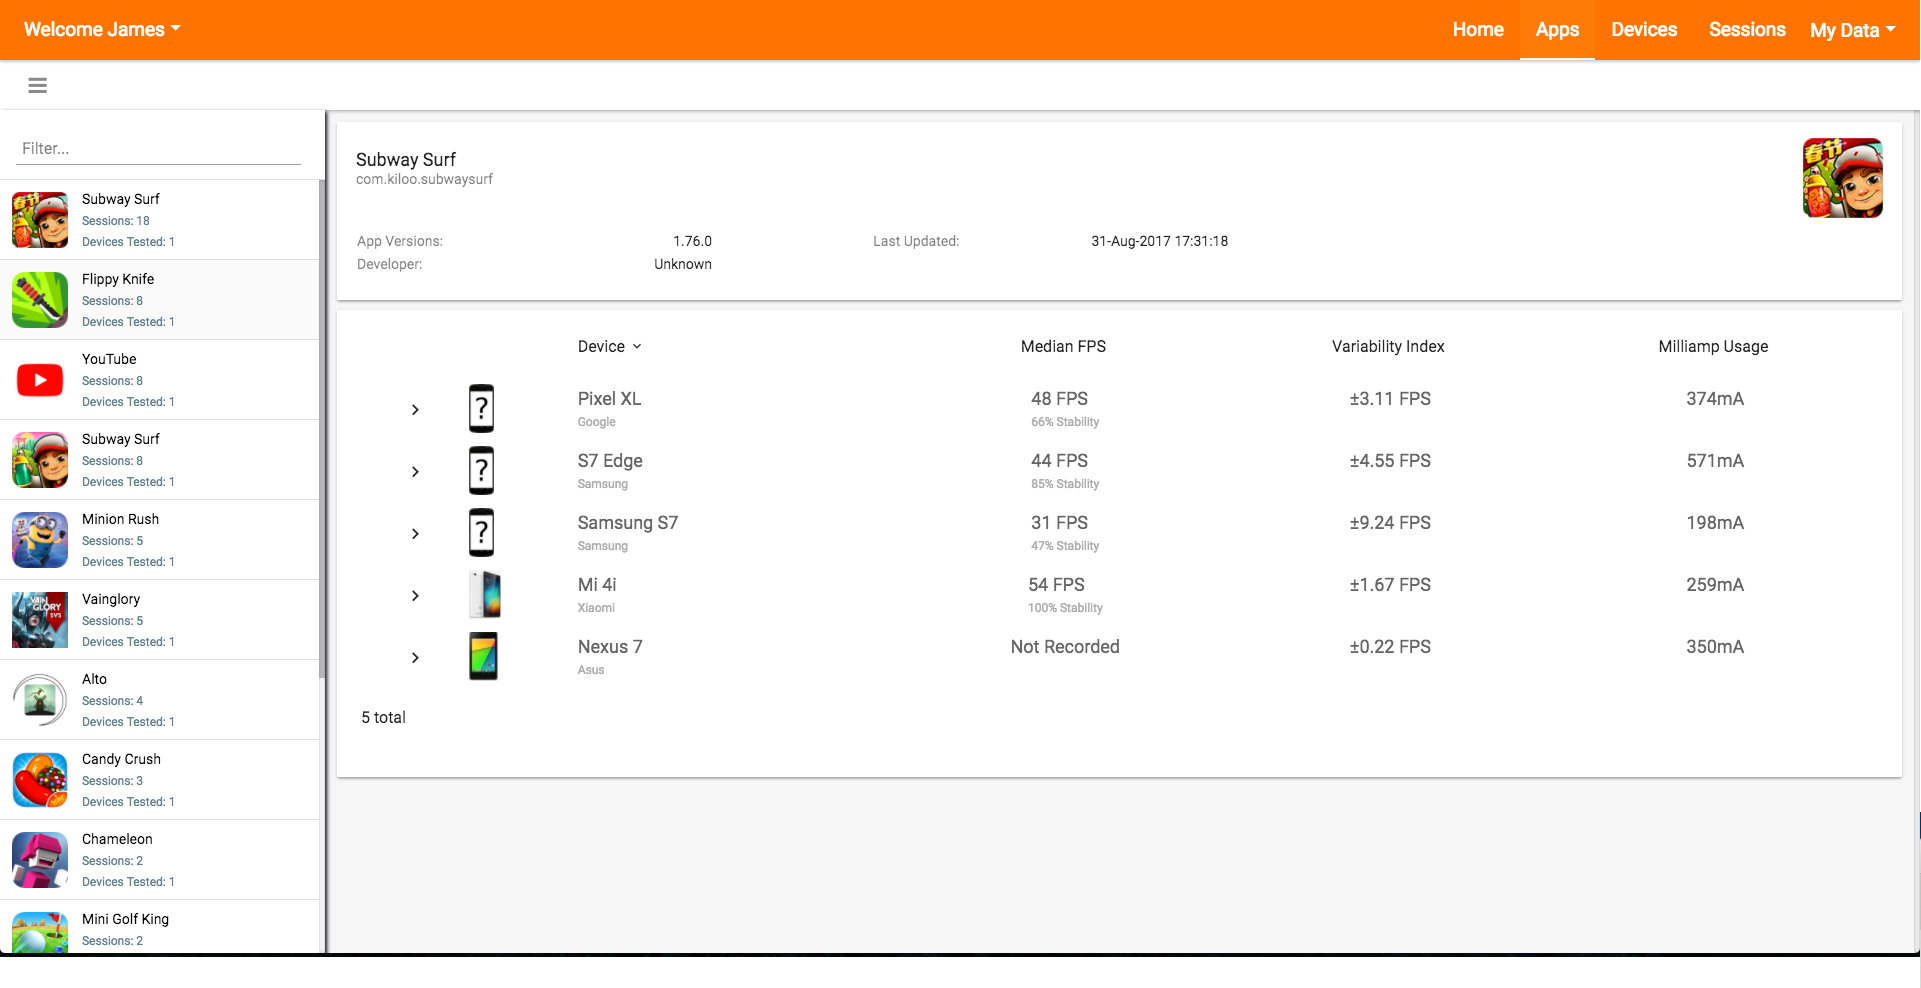
The Apps tab will organise your test data according to a specific app you are interested in. You can list or search for an app in the left column, and, once selected, the central pane will show you all the devices you have tested with this specific app.
On the central pane, you can sort your data to quickly rank the best devices for your selected app – for example, by sorting according to the average frame rate. You can also sort the apps alphabetically.
Clicking the ( > ) to the left of any device will reveal all individual test sessions collected for that device running your selected app. You will see some summary data for each session (Median FPS, FPS Stability and Gameplay Hours), and you can also click into any session to see full details.
The Devices Tab
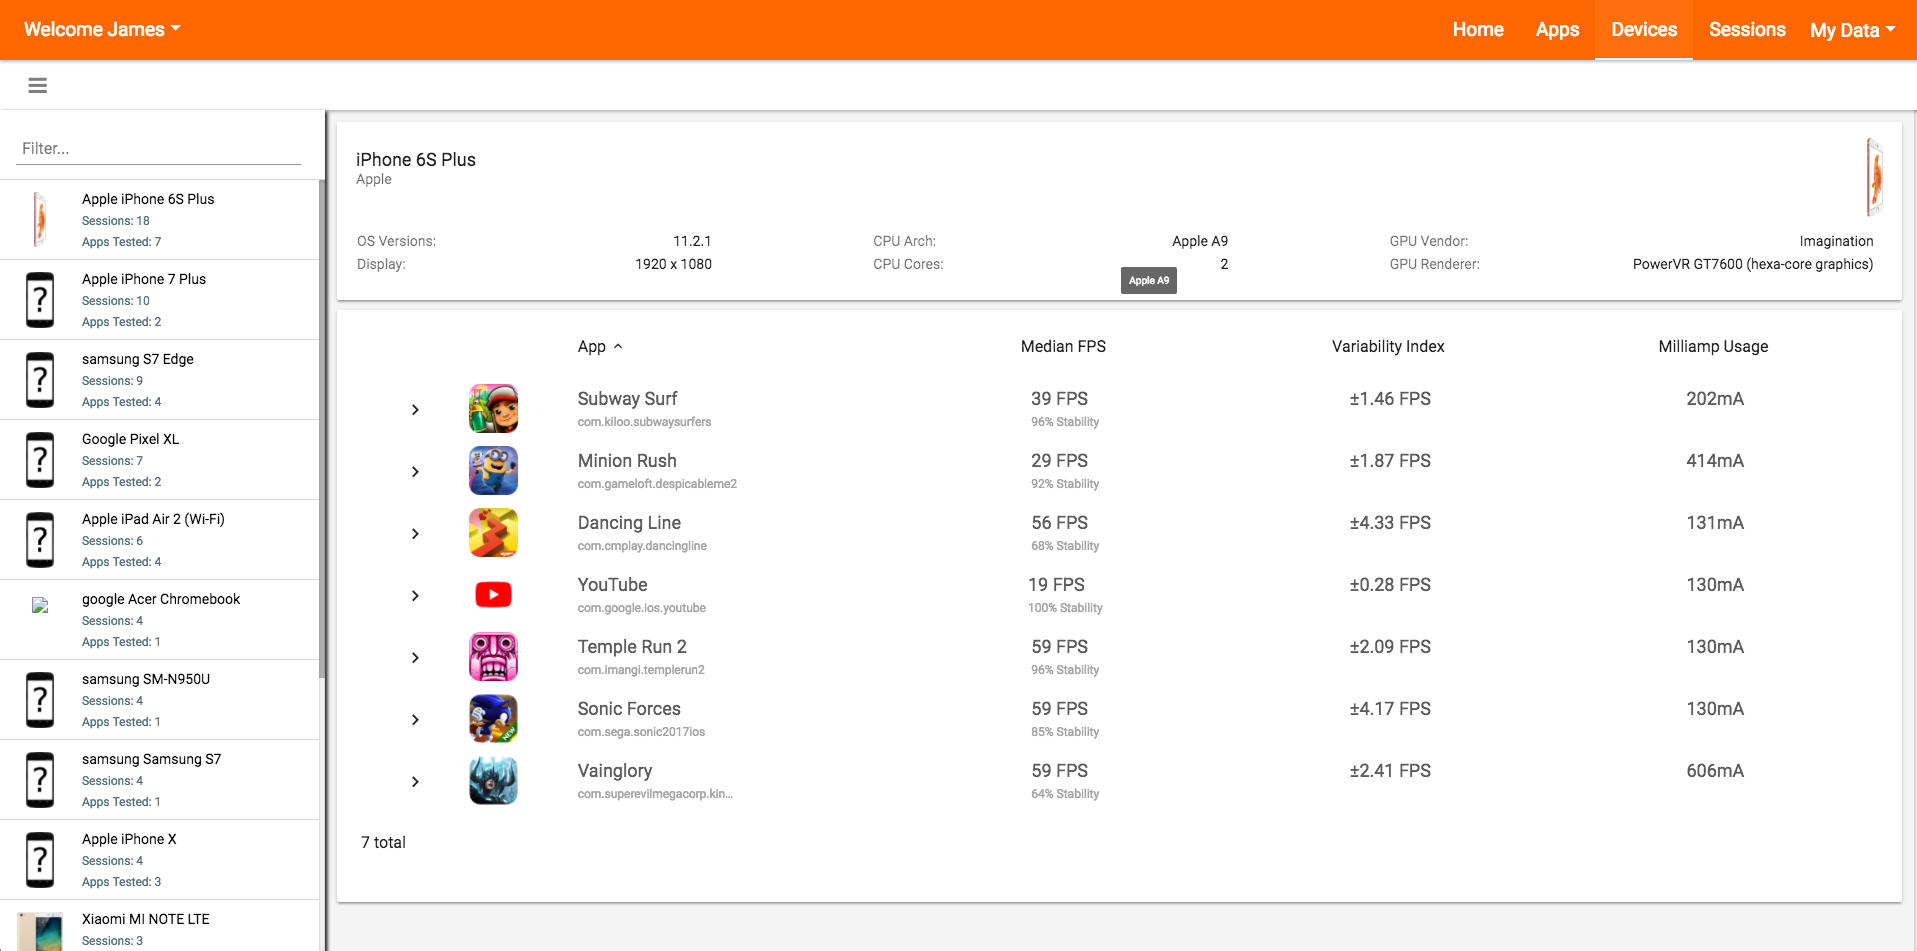
The Devices tab will organise your test data according to a specific device you are interested in. You’ll see a list of devices in the left column, or you can search for a specific model number using the Filter box. Once you’ve found the right device, clicking it will cause the main, central pane to show a list of apps and games tested on that particular device.
On the central pane, you can sort your data to quickly rank the best apps on your selected device, or you can sort the apps alphabetically.
Clicking the ( > ) to the left of any app will reveal all individual test sessions collected for that app, on the device you have selected. You will see some summary data for each session (Median FPS, FPS Stability and Gameplay Hours), and you can also click into any session to see full details.
The Recent Sessions Tab
This tab lists sessions on the right according to how recent they are. You can use it quickly find a session you’ve just completed. You also use this tab to compare multiple sessions side-by-side. For more on how to do comparisons, please refer to the dedicated article: The Marker Pane.