Markers
Although it’s possible to compare entire sessions on the basis of their scorecards (as shown on their respective Summary panes), this isn’t always ideal. Sometimes you will want to compare just specific parts of a session – for example, if you want to compare one particular level of a game across builds or across different devices.
In this case, you can use the Markers pane to set “in” and “out” points that narrow your focus to just one part of the session – excluding any impact from menu screens or other areas of your user experience that you might wish to ignore.
Inserting Markers
You can insert markers in three different ways:
- During testing, by tapping the marker button shown in the GameBench Android app (the first tap will mark an “in” and the second tap will mark an “out”);
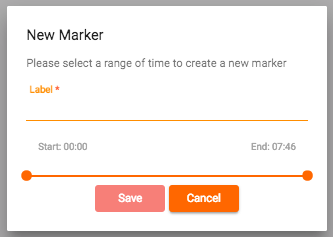
- Retrospectively, by using the “Insert Marker” box within the Marker tab on the GameBench Web Dashboard (as shown below).
- Also using the GameBench Web Dashboard to add markers within any of the charts of your session by using the “Add Marker” tab.
Analysing Marked Areas
Whichever method you choose to insert a marker, the Markers pane on the GameBench Web Dashboard will show you summary metrics specifically for the part(s) of a session that you have marked. These summary metrics will be shown in separate rows, each of which will be entitled with the name of your marker, and each of which will also show the in and out points that it describes (as shown below, in the box entitled “Level 1”).

You can also export summary metrics for marked areas of a session using the “CSV Export” feature by clicking the orange download icon box. This is a useful way of getting a list of all summary metrics in a single CSV file, as opposed to separate CSV files for each type of metric.
Markers Summary
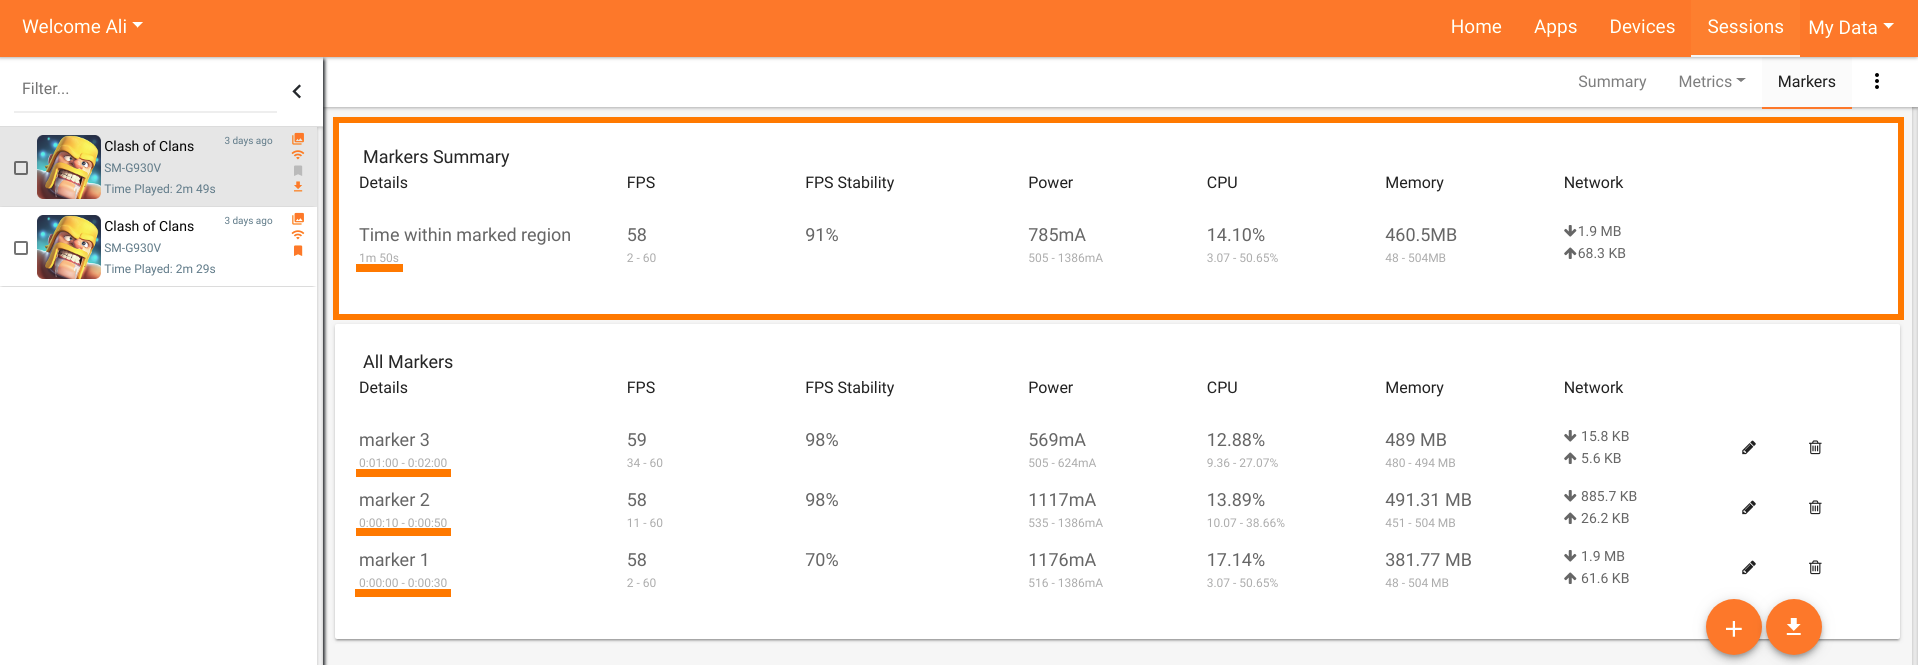
The Markers Summary is displayed at the top of the Markers pane. This feature allows you to view an overall metrics summary of all the markers you wish to add. Any overlapping time regions are ignored between 2 or more markers and a combined region is created. For example if marker 1 is from 0 - 30 seconds and marker 2 is from 10 - 50 seconds, the overlapping time region from 10 - 30 seconds is ignored and a new combined region of 0 - 50 seconds is created (as shown below).

If a third marker is added, lets say from 1 minute to 2 minutes, then a second time region of 60 seconds is created and is combined with the first time region (50 seconds). The final markers summary displayed will be a combination of these 2 time regions also known as stitched regions (as shown below). This summary is recalculated every time you add, edit or delete a marker.
Comparing Marked Areas
One of the best uses of markers is to enable rapid side-by-side comparisons of the relevant parts of multiple sessions. For this to work, all the marked areas you wish to compare with each other must have the same name (including matched capitalisation and spacing).
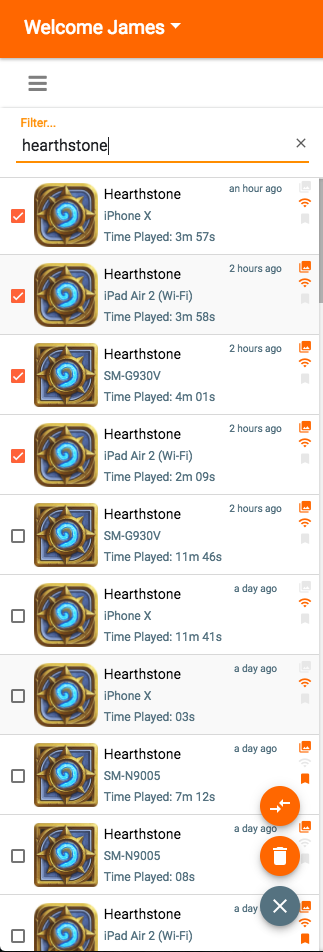
In the example below, a number of sessions of the game “Hearthstone” have been collected across multiple devices. Each of these sessions has been given its own “Level 2” marker, focusing solely on the second level of the game. A search for the word “hearthstone” in the Recent Sessions tab reveals these sessions in the left-hand column:
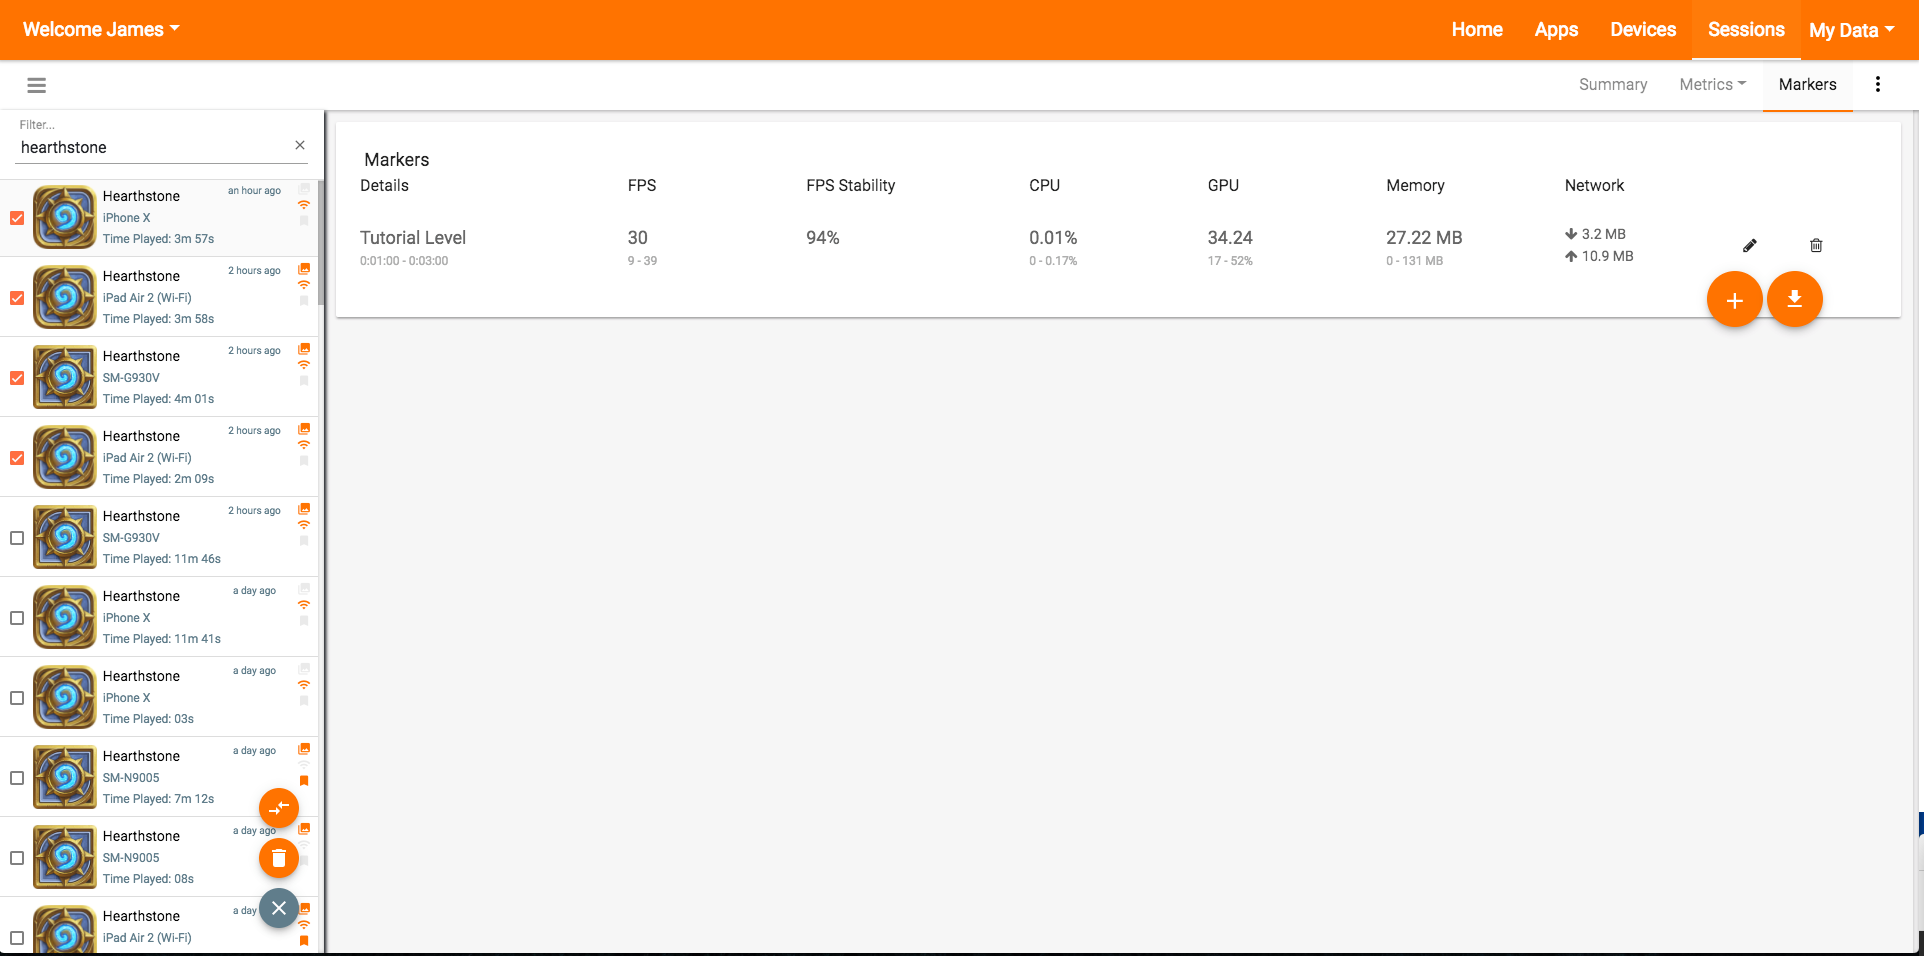
The next step is to click the check boxes next to the sessions you wish to compare:
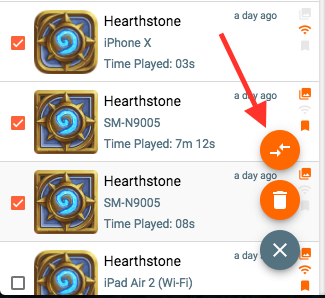
Then select all the sessions which have “Tutorial Level” markers and that you want to include in your comparison, and finally hit the Compare button:
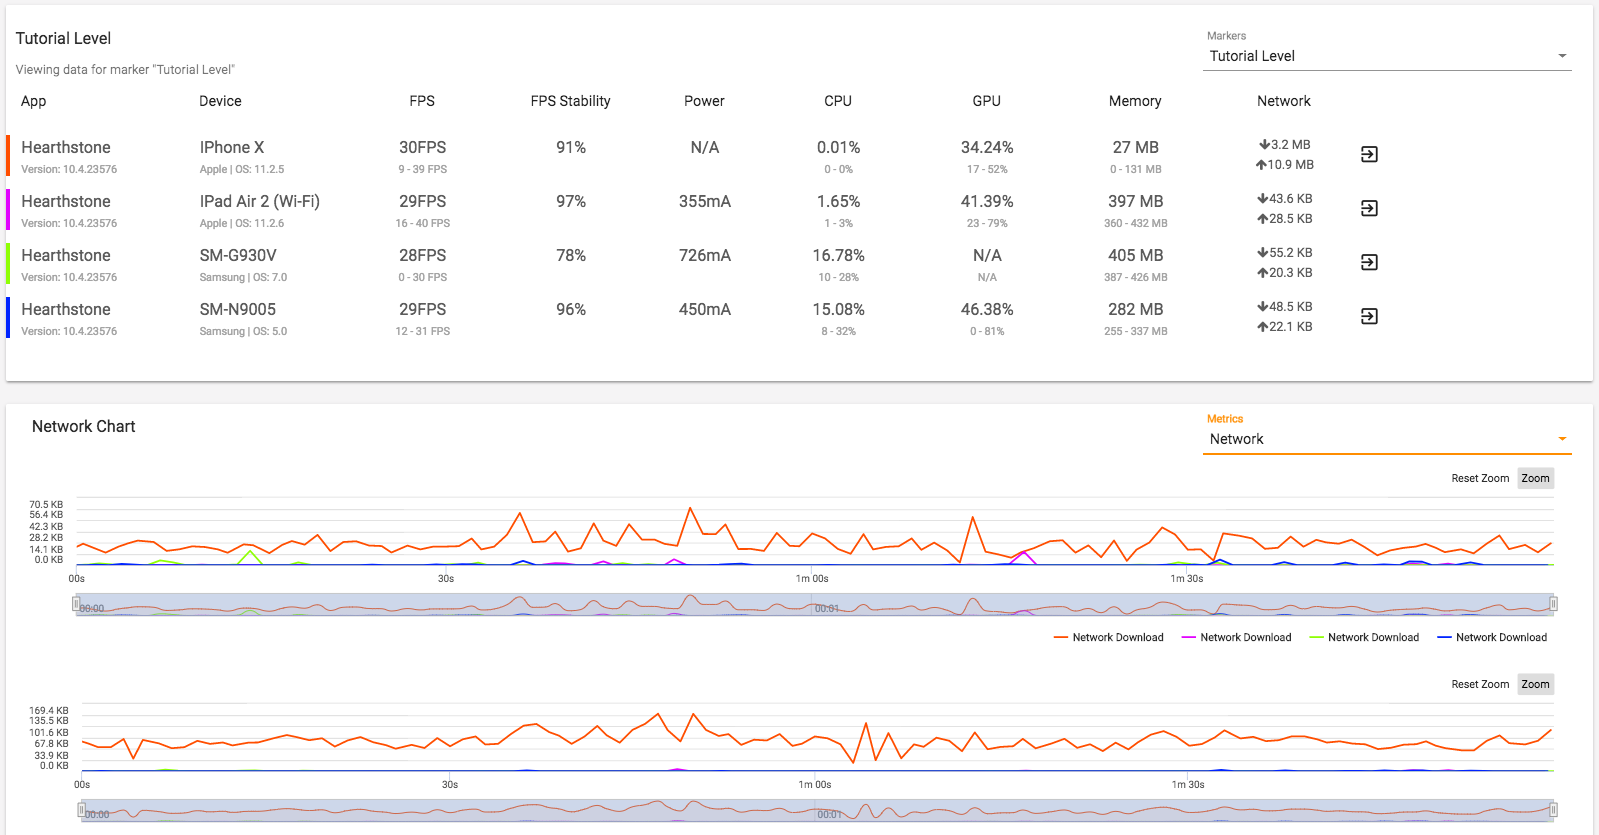
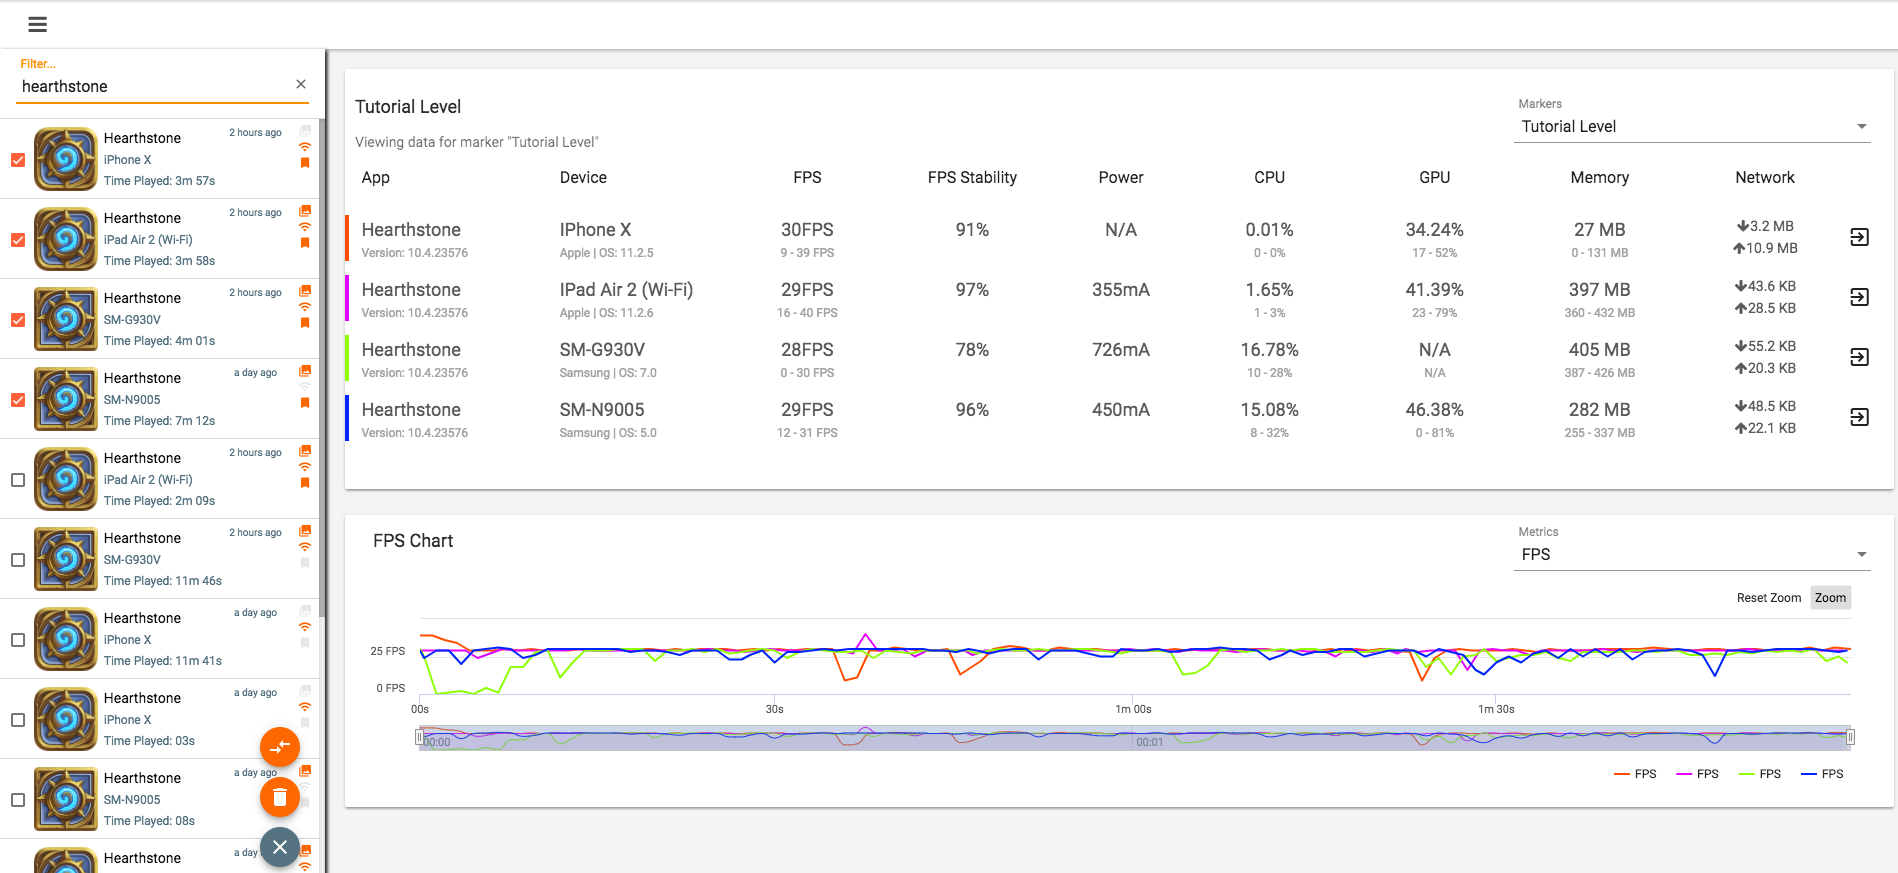
You’ll now be shown a “Comparison Summary” box that compares key metrics for each marked of each session side-by-side. The default first comparison is of frame rates, and in the example below you can quickly see which devices manage to play the “Tutorial Level” of Hearthstone at better frame rates:
You can change the comparison to look at other metrics, using the pull-down menu in the “Metrics” box. Whichever metric you pick, it’s possible to click on the row of numbers to see charts side-by-side. In the example below, Network Data is compared across all four devices, and the charts of the top two devices are shown (with more made visible by scrolling down). You can exit this chart view at any point by clicking back into any session on the left:
