Power
The Battery pane is accessed either from the Metrics pull-down menu, or by clicking on one of the power-related scores on the Summary pane. Its purpose is to quickly highlight whether a particular pairing of app and device is leading to excessive power consumption or temperature increases.
Every genre of app or activity, from music streaming to playing graphically-intensive 3D games, has its own typical drain-rate that users have come to expect. But as soon as a product (whether it’s an app, game or device) goes beyond this expected drain-rate, a user is more likely to complain about it and ultimately abandon it.
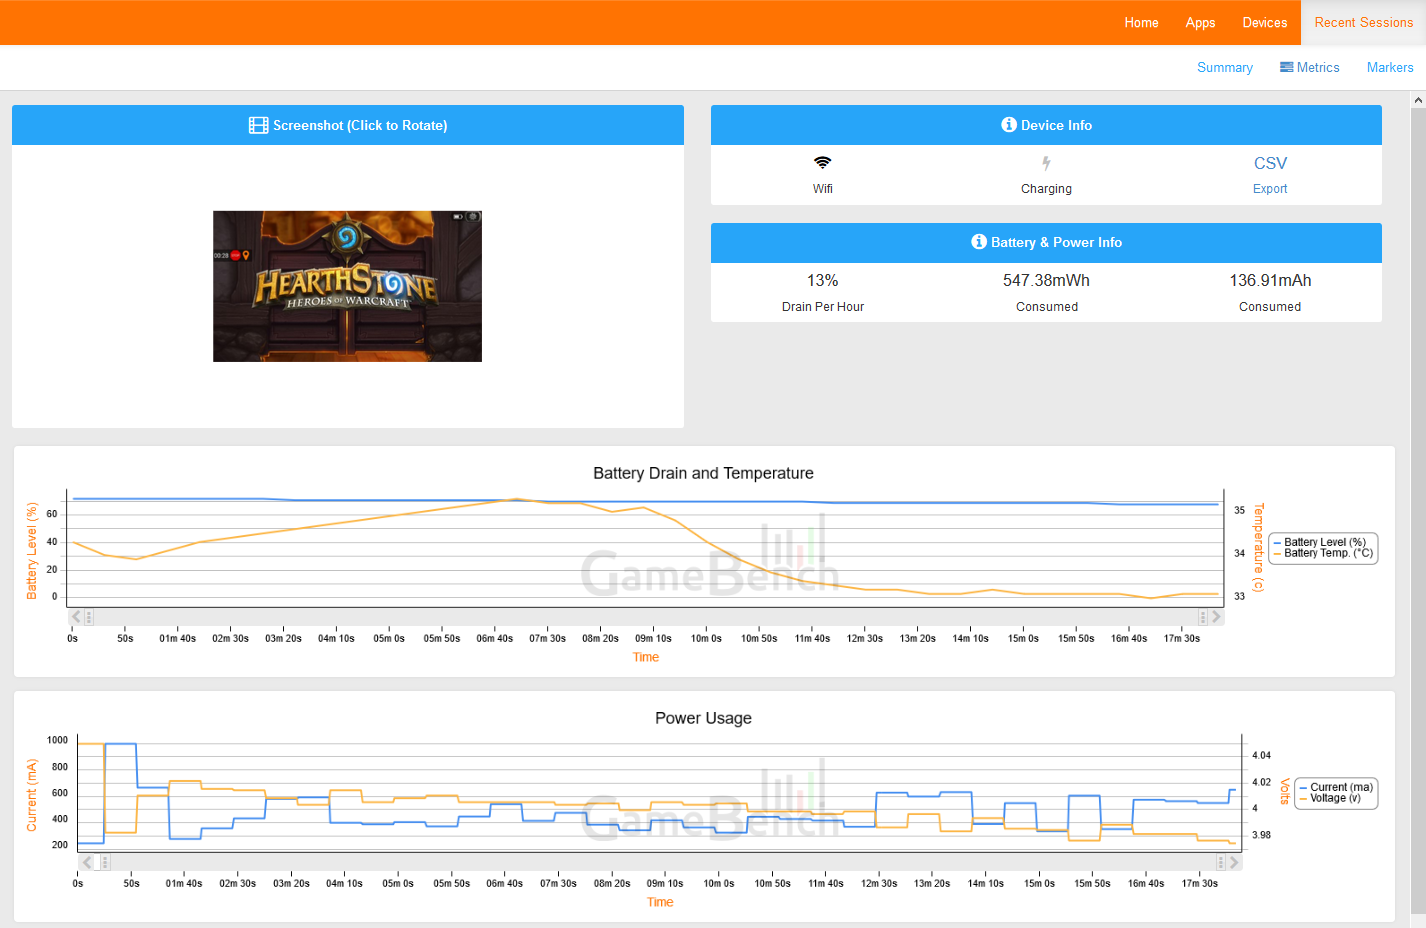
Screenshot Box
As with the other metrics, the Screenshot box lets you correlate power activity to what was happening onscreen at the time. You can click the image to rotate it to the correct orientation.
Device Info Box

The Device Info box gives two key power settings of the device-under-test: whether it was connected to WiFi and whether it was charging (either over USB or AC charger).
If the WiFi indicator is black, rather than greyed out, any data required by the app will have been sent over a WiFi connection, which generally requires less power than data transferred over the cellular network.
If the Charging indicator is black, this means the device was charging during all or some of the test, in which case its power consumption cannot be trusted. (Charging interferes with all power metrics that GameBench collects.)
Finally, you can also export CSV values using the button in this box.
Battery & Power Info Box
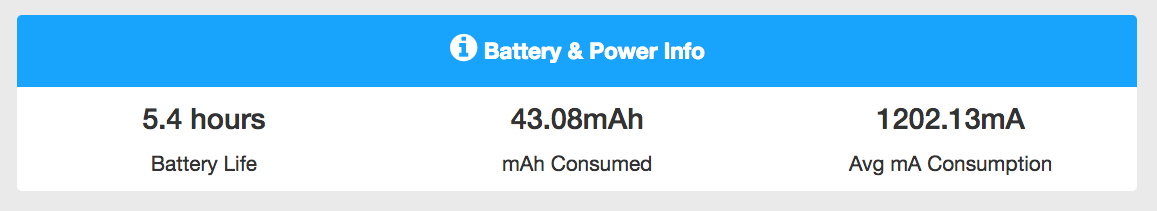
The Battery & Power Infobox provides three numbers that together provide a snapshot of overall system power consumption during a test session (including the power used by the screen, the connectivity components, background processes and all other aspects of the device):
Drain Per Hour: This percentage extrapolates the hourly battery drain rate from the observed rate of drain. On certain iOS and Android devices where instantaneous power metrics are available (reported directly by the device hardware), GameBench will compute this by dividing the battery capacity of the device (in mAh) but the average current drain (in mA) in order to produce a result in hours. Relatively accurate estimates of expected battery life can be achieved with just five minutes of testing.
On certain Android devices where instantaneous power metrics are not available to GameBench (such that there are no mA readings), but OS-level battery stats are available, GameBench will simply extrapolate from the observed rate of drain in terms of percentage of battery lost per hour. E.g., if a 20-minute test session of a game caused the device’s battery level (as reported by the Android OS) to fall from 80 percent to 70 percent, then the game’s hourly drain rate would be 30 percent (60/20 x 10). For such devices, we’d recommend that tests last for at least 15 minutes, because battery drain rates can be erratic.
mAh Consumed: GameBench gathers this metric directly from recent Qualcomm Snapdragon and Samsung Exynos chipsets, and also calculates it from iOS devices. It’s extremely helpful to app and game creators because it’s collected using instantaneous power readings straight from the hardware and is more accurate (to within +/-5 percent of lab tests) than battery stats reported by the OS.
“mAh Consumed” reflects the quantity of current (in milliamp-hours) used during the session. This quantity is determined not only by the power appetite of the device and the app-under-test, but also by session duration – longer test sessions will consume more milliamp-hours.
Since the battery capacity of a mobile device is also often reported in mAh, “mAh Consumed” can give you a quick idea of how much battery has been used. For example, 200mAh Consumed would mean that roughly 10 percent of Galaxy S3’s battery (2,100mAh) has been used, or roughly 5 percent of a Meizu M3 Note’s battery (4,100mAh).
Average mA consumption: Unlike the “mAh Consumed” metric, Average mA consumption is independent of test duration. It’s the average of all current draw readings collected during the session. As with “mAh Consumed,” this metric also comes from instantaneous power readings offered by certain iOS devices, and Snapdragon- and Exynos-powered Android devices.
Note: Additional Power Metrics
Compatible Android devices will also show average power draw (mW) and total power draw (mWh), as additional metrics to current readings.
Note: User-perceived vs. Instantaneous Power
Although instantaneous power metrics (in mA or mAh) are always the most accurate, it’s also important to take into account user-perceived power drain. This isn’t possible on iOS devices, but on Android, it can be achieved by looking at the Battery Drain and Temperature Chart, described below.
Sometimes, even if a game is relatively efficient in engineering terms (e.g. based on mA measurements), users will still be unhappy if they observe their battery depleting rapidly – and they will blame the game even if the battery is actually depleting as a result of a previous workload that was conducted before the game was played (which is a common predicament with OS-reported battery stats).
Battery Drain and Temperature Chart
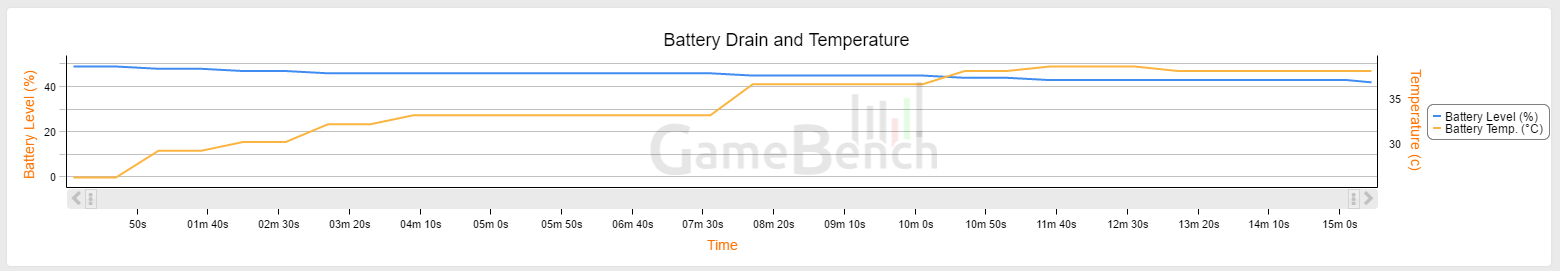
The Battery Drain and Temperature chart help to visualize user-perceived battery drain (the blue line) across the duration of the session. It also displays battery temperature (the orange line) over time. Just as a user might notice a rapid decline in their battery status, they may also notice significant temperature rises in the palm of their hand – giving the impression that an app, game or device is particularly power hungry. Both of these metrics – battery status and battery temperature – are reported by the Android OS.
Power Usage Chart
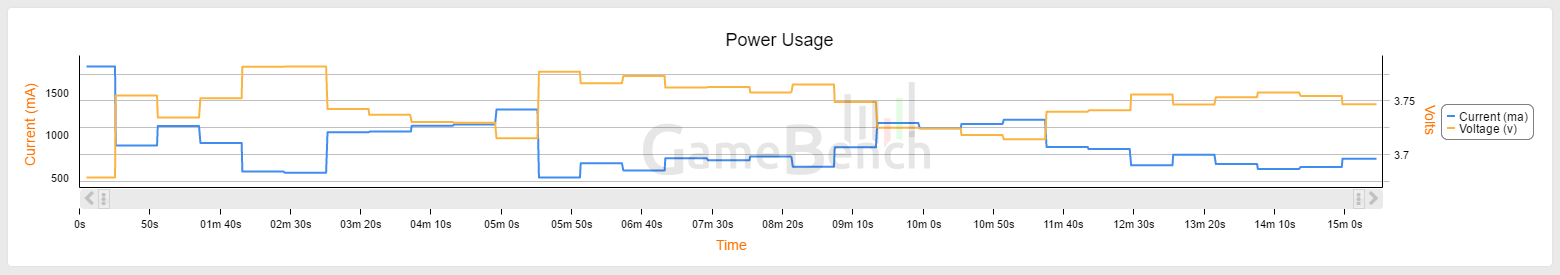
On Android, the Power Usage chart shows two instantaneous power metrics – amperage (mA, blue line) and voltage (V, orange line) – across the duration of your session. If you look for areas of the chart that show particularly high amperage (and yet with voltage staying within a narrow range), then this can help you to pinpoint parts of an app-under-test that are particularly power hungry – perhaps because these parts use more CPU, GPU or network traffic.
What should you look for?
Every type of app has its own healthy range of power values, so it’s difficult to generalise. Ideally, you should test your own app, game or device repeatedly across different use cases, and compare it to your closest competition, in order to define a healthy range of power consumption that is most useful to you.
Nevertheless, GameBench’s crowdsourced database does provide some useful insights:
-
A Drain Per Hour of more than 30 percent (implying around three hours of use on a single charge) puts a device-app pairing into the top 6 percent of power-hungry sessions in our database. We’ve found that games and devices that drain power this quickly tend to get classed as battery hogs in user reviews on the Play Store.
-
Most apps and devices within our database show a temperature range of 25 degrees Celsius to 40 degrees Celsius. Occasionally, in around 3 percent of crowdsourced sessions, we see intensive games and VR applications that push battery temperature above 45 degrees Celsius, and this tends to be very noticeable to the user. In addition to the perception of heat, severe temperature increases can cause the device to throttle its performance in order to avoid over-heating, which can further be detrimental to the UX.
-
As a baseline for instantaneous power, a screen-off use case such as streaming music over a 4G network (with the screen only turned on a few times), uses an average power of around 900mW on recent, high-end Android devices (i.e. around 450mWh consumed in a typical half-hour session).
-
Adding display power consumption for a screen-on use case, such as streaming video over 4G, adds around 1,000mW to the average power. This means a video-streaming service can be expected to use around 1,900mW (or around 950mWh consumed in a typical half-hour session) on a recent, high-end Android device. A casual 2D game can be expected to burn roughly the same amount of energy.
-
When you add more intensive CPU and GPU usage, for example by playing a fast-paced 3D game with a 60fps frame rate, you can easily add another 1,000mW of power consumption, bringing the total to 3,000mw (3W). There are also games that make heavy use of geolocation and these can use as much as 3.5W of power.
Power-testing tips
To achieve meaningful results across multiple tests, it’s important to define some device settings which will remain fixed. These settings should include aspects of device behaviour that affect power drain, such as display brightness and Bluetooth/WiFi/NFC connectivity, as well as GameBench’s own profiling options, so that GameBench’s own power overhead is kept constant.
You can also define background apps and processes, to ensure that they are constant. Then, again it’s sometimes worth identifying background processes that your users tend to have running that are draining the battery. Often users will complain about a foreground app’s power consumption, when it was a background (e.g. Skype) that was the real culprit.
For further tips, please check out this GameBench blog post: How do you know if your app is a battery hog?
iOS Power Usage - Things to Note
We use the Energy Diagnostics instrument mentioned here to get the instantaneous current drain for an iOS device.
In order to reliably measure the average current drain (in mA), the device needs to be put in Wireless mode and any USB cable disconnected. For details on enabling Wireless mode and measuring power please look at the following video
https://www.youtube.com/watch?v=o2DLzATRfjM
Please take a note of the following cases where we are unable to measure the current drain due to bugs present with Apple’s Instruments software stack.
iOS Versions 9.3.5 - 10.2
If you are using one of the iOS versions above, then GameBench will not report current drain. This is because of a bug that caused no values to be returned from the Energy instrument. This was fixed with iOS version 10.3.
Newer iOS Devices
All devices from iPhone 8 onwards don’t work if you would like to measure average current drain during the gaming session. Apple has acknowledged this as an issue. The above mentioned Energy Instrument and GameBench don’t work. The list of devices that have an issue is mentioned below.
- iPhone 8
- iPhone 8 Plus
- iPhone X
- iPhone XR
- iPhone Xs
- iPhone Xs Plus
For these devices, GameBench Desktop App records the battery level as reported by iOS. This data is then used to compute the battery drain rate for the session. This only works if you are using the GameBench Desktop App on a MacOS host.
We are investigating alternative ways to measure instantaneous current for above-mentioned devices. If you would like to measure the current drain and expected play time of your game, we suggest using a device prior to iPhone8 (iPhone 7, iPhone 7 Plus or lower work well).
Summary of support for measuring iOS Power:
| Device | iOS Version | Battery Drain Rate | Average Current Drain |
|---|---|---|---|
| iPhone 8 or newer | Any | Yes | No |
| iPhone 7 Plus or lower | 9.3.5 - 10.2.3 | Yes | No |
| iPhone 7 Plus or lower | Version 10.3 or higher Version 9.3.4 or lower |
Yes | Yes |