Metrics Details
Primary Metrics
User Experience
| Metric | Description |
|---|---|
| FPS | The Frames Per Second the user sees, ie the number of frames actually presented to the user |
| Input to action latency | The latency (in ms) between user input and the corresponding action is seen on the screen. For cloud gaming this include latency induced by the network see image below 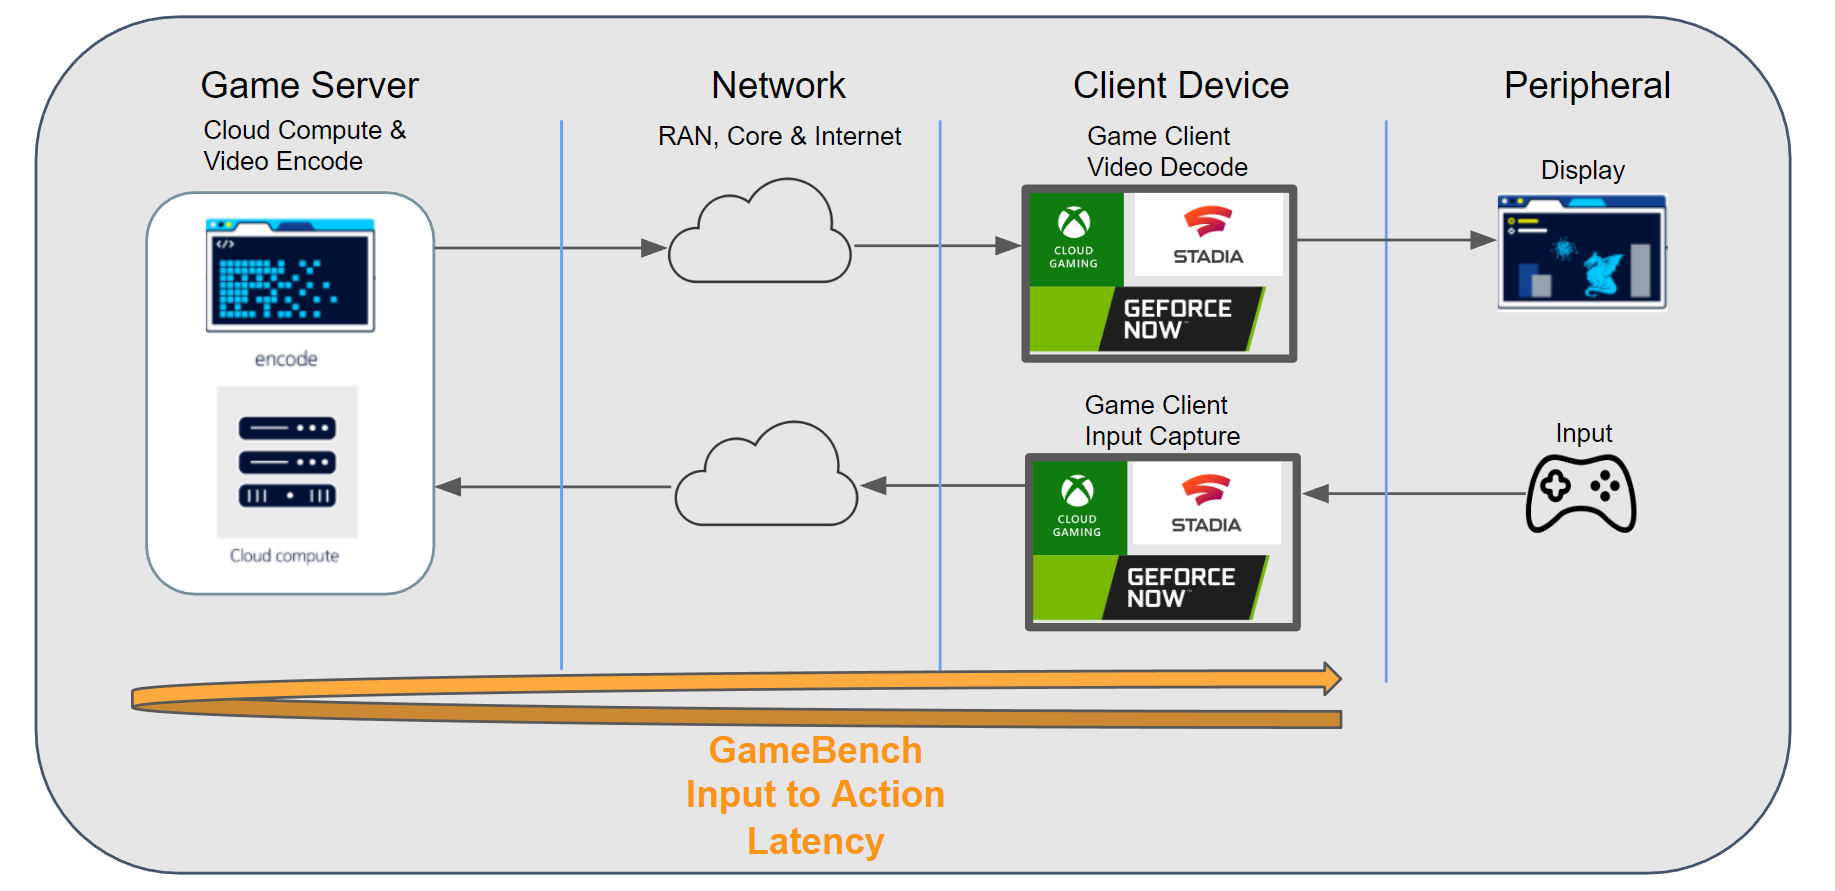 |
| ImageQuality | Image Quality is a subjective metric, and its method measurement can change depending on the use case. GameBench do not currently provide a single Image Quality metric but can measure the following; - Resolution - BitRate - Image Blockiness |
Secondary Metrics
Network Metrics
Trace Route
ProNet issues a trace route every 5 seconds to determine A) the number of hops between the client and server and B) the route the packets take geographically. The trace route metric have the following fields
| Field | Description |
|---|---|
| timestamp | The timestamp of the trace route measured in ms from EPOCH |
| hops | An array containing the address of each hop. Each address can be either IPV4 or IPV6 |
ICMP RTT (Ping)
ProNet measures the RTT of each hop between the client and server (inclusive) every 1000ms. It also measures the RTT of each hop at the point the user triggers an Input to Action latency calculation. Each RTT entry has the following fields
| Field | Description |
|---|---|
| timestamp | The timestamp of the ping measured in ms from EPOCH |
| endpointType | The endpoint type can be on of the four values 0. Local gateway 1. Internet reference (Usually Google DNS 8.8.8.8) 2. Remote server 3. Hop, ie on of the nodes between the local gateway and the remote server |
| destinationAddress | The IP address of this particular RTT sample |
| roundTripTime | The time in ms it took to for a message to reach the destinationAddress and return back |
| success | If false then this sample failed (potentially due to packet loss) otherwise true. If false roundTripTime would be 0. |
RTT Jitter (Ping Jitter)
Jitter is calculated from the ICMP RTT samples and has the following fields
| Field | Description |
|---|---|
| timestamp | The timestamp of the jitter sample measured in ms from EPOCH |
| endpointType | The endpoint type can be on of the four values 0. Local gateway 1. Internet reference (Usually Google DNS 8.8.8.8) 2. Remote server 3. Hop, ie on of the nodes between the local gateway and the remote server |
| destinationAddress | The IP address of this particular RTT sample |
| jitter | The average difference in ICMP RTT samples calculated as a moving average over a period of 10 seconds |
Data Usage
Both up and down data rates are recorded for the selected app. This includes all TCP and UDP packets. The metric contains the following fields
| Field | Description |
|---|---|
| timestamp | The timestamp of the sample measured in ms from EPOCH |
| downloadSpeed | The current rate in Bytes per second, the application is receiving data |
| uploadSpeed | The current rate in Bytes per second, the application is sending data |
| appTotalReceivedBytes | The total number of Bytes the application has received since start of the session |
| appTotalSentBytes | The total number of Bytes the application has sent since start of the session |
| appReceivedBytes | The number of Bytes the application has received since the last sample (0 if first sample) |
| appSentBytes | The number of Bytes the application has sent since the last sample (0 if first sample) |
WebRTC Stats
When using online services via a chrome browser like a cloud streaming or video conferencing service it is most likely they the WebRTC standard, and therefore GameBench ProNet can collect the WebRTC stats using the GameBench Chrome Extension. The WebRTC stats standard has many different metrics, GameBench tools focus on the video and audio streams both received and sent.
WebRTC Inbound Audio Stream
| Field | Description |
|---|---|
| timestamp | The timestamp of the sample measured in ms from EPOCH |
| avgJitterBufferDelay | The avg jitter buffer delay since calculated since the last sample. The jitter buffer delay is the delay induced by the buffer that stores packets before audio samples are processed. For more information see the official WebRTC Stats documentation |
| nackCount | The total number of Negative ACKnowledgement (NACK) packets |
| packetsLost | Total number of RTP packets lost. Please note that most WebRTC streams use UDP streams and so due to the way lost packets are calculated it can be negative if more packets are received than sent. See the official documentation for more information |
WebRTC Inbound Video Stream
| Field | Description |
|---|---|
| timestamp | The timestamp of the sample measured in ms from EPOCH |
| frameWidth | The horizontal resolution of the encoded video stream |
| frameHeight | The vertical resolution of the encoded video stream |
| framesDecoded | The total number of frames decoded in this stream |
| avgJitterBufferDelay | The avg jitter buffer delay since calculated since the last frame. The jitter buffer delay is the delay induced by the buffer that stores packets before video frames are processed. For more information see the official WebRTC Stats documentation |
| nackCount | The total number of Negative ACKnowledgement (NACK) packets |
| packetsLost | Total number of RTP packets lost. Please note that most WebRTC streams use UDP streams and so due to the way lost packets are calculated it can be negative if more packets are received than sent. See the official documentation for more information |
| pliCount | The total number of Picture Loss Indication (PLI) packets |
| codecId | The codec identification |
| packetsReceived | The total number of packets received |
| bytesReceived | The total number of Bytes received |
| framesPerSecond | The number of frames decoded per second |
| framesReceived | The total number of frames received |
| avgDecodeTime | The average decode time of a frame, calculated since the last sample |
| avgProcessingDelay | The average processing time of each frame, calculated since the last sample. The process delay is defined as the time between the first packet received to the frame being decoded. More information can be found in teh official documentation |
WebRTC Outbound Audio Stream
| Field | Description |
|---|---|
| timestamp | The timestamp of the sample measured in ms from EPOCH |
| nackCount | The total number of Negative ACKnowledgement (NACK) packets |
| packetsSent | Total number of packets sent |
| targetBitrate | Total target bitrate |
WebRTC Outbound Video Stream
| Field | Description |
|---|---|
| timestamp | The timestamp of the sample measured in ms from EPOCH |
| frameWidth | The horizontal resolution of the encoded video stream |
| frameHeight | The vertical resolution of the encoded video stream |
| framesSent | The total number of frames sent |
| nackCount | The total number of Negative ACKnowledgement (NACK) packets |
| pliCount | The total number of Picture Loss Indication (PLI) packets |
| totalEncodeTime | The amount of time spent encoding frames. |
Device Metrics
GPU Usage
GPU usage is constantly measured to allow analysis to check for possible GPU bottlenecks. The GPU metric has the following fields
| Field | Description |
|---|---|
| timestamp | The timestamp of the GPU usage sample measured in ms from EPOCH |
| usage | The GPU usage measured in % (0-100). A GPU has many different areas that could be loaded, and so the field will show the percentage of the highest loaded part. For example whilst playing a native game this will most likely be the 3D engine however if you were playing a cloud gaming this would most likely be the decode engine |
CPU Usage
CPU usage is constantly measured to allow analysis to check for possible CPU bottlenecks. The CPU metric has the following fields
| Field | Description |
|---|---|
| timestamp | The timestamp of the GPU usage sample measured in ms from EPOCH |
| usage | The CPU usage of the application measured in % (0-100). |
Memory Usage
Memory usage is constantly measured to allow analysis to check to see if any graphical hitches were caused by a memory issue; either by a lack of memory or a garbage collection event. The GPU metric has the following fields
| Field | Description |
|---|---|
| timestamp | The timestamp of the GPU usage sample measured in ms from EPOCH |
| usage | The mem usage of the application measured in Bytes. |