FPS

The FPS Pane displays metrics and charts that relate to the visual smoothness of your game or app. This smoothness is principally measured by means of the frame rate, which is the number of frames rendered onscreen each second (i.e. the rate of animation) and frame rate stability, which describes the variability of the frame rate across a test session.
Frame rates have long been a staple in the world of PC graphics and gaming, because they are the closest objective to correlate the visual smoothness and responsiveness of a user experience. The higher the frame rate, the smoother and more convincing animations appear and the quicker a piece of software, such as a game or scrolling UI, will appear to respond to user inputs.
On Android, there is an additional FPS metric in the form of “janks,” which records significant changes in the draw times of consecutive frames of animation. Alongside frame rate and frame rate stability, janks will also be explained in this section.
Navigating to the FPS Pane

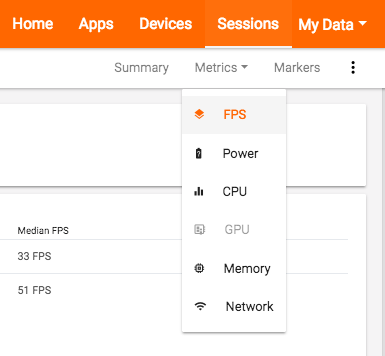
You can view the FPS Pane either by choosing “FPS” from the Metrics selector (shown below), or by clicking on either of the summary frame rate metrics shown on the Summary Pane.
Screenshot Box

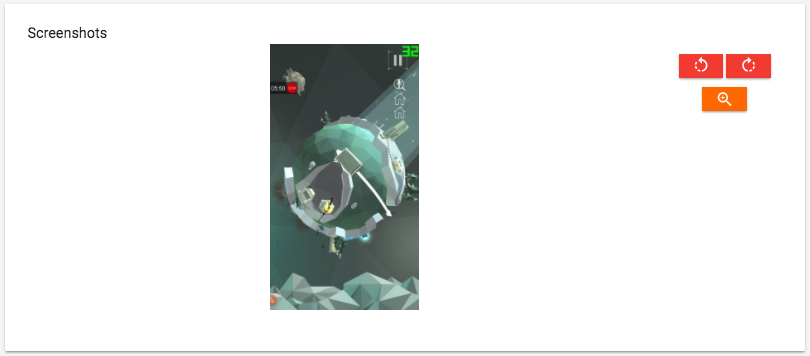
As with every other metric pane, the first box on the FPS pane shows you screenshots, which are captured once per second. These screenshots allow you correlate frame rate changes with what was happening onscreen at any given moment. The correlation between a particular screenshot and a particular point on the timeline of a chart has a precision of +/-2 seconds.
Clicking the image in the Screenshot Box will rotate it, so that you can correct its orientation, if necessary.
FPS Info Box

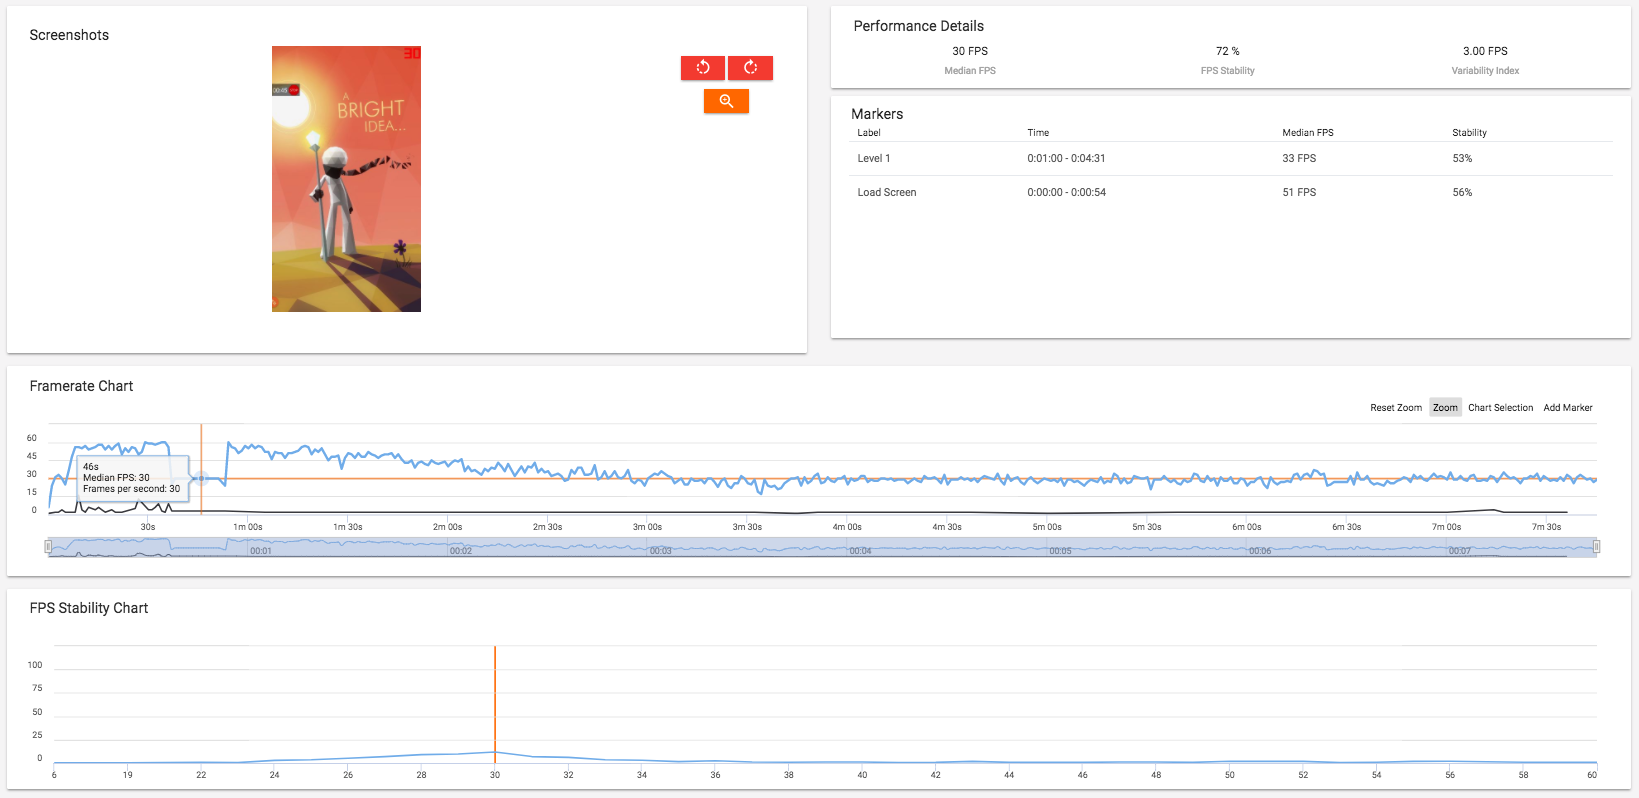
In the top-right of the FPS pane you’ll see the FPS Info Box. This shows three summary metrics that describe the visual smoothness of the entire test session.
(Note: These summary metrics are tailored for game testing rather than app testing. If you’re interested in testing the smoothness of apps, please see the “FPS Stability Chart” section below, as that is the most relevant part of the FPS Pane for app testers.)
Here’s a description of the three summary metrics shown in the FPS Info Box:
Median FPS – This the median frame rate, which is the middle frame rate value from the list of all frame rate samples recorded during a test session, after they’ve been ordered from lowest to highest. GameBench emphasises this type of measurement, rather than the mean, because it helps to overlook fringe readings. For a heavily animated game, you might aim to see a Median FPS of at least 29/30fps in this box. Then again, 60fps is a better target for VR and AR experiences which try to blur the line between real and virtual worlds, and for many types of games which rely on realistic physics simulation (such as the Angry Birds franchise), or on rapid player reflexes (such as Crossy Road), or on smooth camera scrolling with multiple moving objects (such as Monument Valley or Vainglory). 60fps is also essential if you want to create a user interface that matches the smoothness of the underlying Android or iOS operating systems (both of which animate at a steady 60fps).
FPS Stability – This is the percentage of the session duration that was animated at a frame rate close to the Median FPS, with “close” being defined as +/- 20 percent. If FPS Stability is below 50 percent, it means that more than half of the test session ran at frame rates that were far away from the median, such that the median isn’t a very useful descriptor of the experience. By contrast, if FPS Stability is over 75 percent, then the experience can be described as stable, at around the median fps. Having collected test sessions spanning thousands of apps running on thousands of different device models, we tend to regard a stability of 80 percent as “good.”
Variability Index – This is an alternative measurement of frame rate stability, which describes the average variance between consecutive frame rate readings. In the example shown above, there was an average variance of less than 2fps between consecutive readings, which is further evidence that the frame rate was consistently smooth. The benefit of this alternative stability metric is that it is independent of the Median FPS, and is therefore less likely to punish changes in frame rate that were deliberately intended by the developer.
For example, imagine a space combat game that consists of two main playable parts: a series of strategy screens that maintain a deliberately targeted animation rate of 30fps, and then a combat part that maintains 60fps. If the combat part makes up the 60 percent the session duration, then the Median FPS will be high (i.e., 60fps), but the FPS Stability score may seem unfairly low (i.e., only 60 percent). However, if the Stability Index shows a healthy, low figure of 2fps, we can judge that both the strategy sections and the combat sections were internally quite stable, regardless of the fact that they each animated at very different frame rates.
The FPS Marker Box

If you have set any markers for the test session, then this box will show you summary frame rate metrics specifically for marked areas. In the example shown above, in/out markers have been set to describe the “Level 1” of a game, which lasted for 3 and a half minutes. This section of the game was fairly smooth (33fps) and not very stable (53 percent).
The FPS Chart (and Janks)

The FPS chart displays FPS on the Y-axis, coloured blue and the session timeline on the X-axis. Typically for a game, you will see long sections where FPS is broadly stable, representing playable areas of the game, interspersed by more erratic periods where FPS occasionally drops to zero, which will often represent menu screens and loading screens that appear between playable sections.
Looking for FPS drops: One benefit of the FPS Chart is to look for drops in frame rate that specifically occurred during playable moments when a consistent FPS is most critical to the user experience. In the example above, there are erratic changes in the chart near the start, and also around 6:30 – but both of these changes correspond to between-game screens. The FPS drops which matter more are those between 1:00 and 6:30, approximately, where the blue line occasionally stoops as far as 16fps – representing a loss of smoothness that may well be visible to the user.
Spotting janks: On test sessions captured using the GameBench Android app, and when janks recording has been enabled on this app, you will also see a black line indicating the presence of janks in your session. For this black line, the Y-axis shows the number of janks recorded in one second, and the X-axis shows the session timeline. The presence of large numbers of janks on the chart can be used as a predictor of micro-stutter (i.e. stutters that last for less than a second, but which may nevertheless be visible to the user), and it will often be correlated with frame rate drops and excessive stress on the GPU.
An example of janks: In a jank-free experience, where the black line never rises above zero, there is a perfectly constant relationship between the time the device takes to draw each frame, and the refresh rate of the display. For example, if we take a typical mobile device with a 60Hz display, then the time between each refresh is 16ms. If this device takes 17ms to render the frame of a game, then this new frame won’t be ready in time for the next refresh, but will be ready in time for the second refresh – resulting in a ratio of 2. Even if subsequent frames take a bit longer, perhaps 25ms or 32ms, then this ratio will still be 2 and there will be no janks. The game will simply feel like a steady 30fps game – like the one shown in the example chart above.
However, let’s say a frame comes along which, due perhaps to a particularly large explosion effect, takes 34ms to render. This frame will now not be ready until the third display refresh, increasing the ratio to 3. The frame rate may not capture this incident, but the change in ratio will be recorded as a jank, and the user may well perceive it – because they will experience a static screen lasting for two intervening display refreshes, rather than just for one. In the example chart shown above, a large bunch of janks are recorded, near the start of the timeline – a period that corresponds with a particular “Welcome” animation, and which happens to correlate quite closely with a sustained frame rate drop.
For a full technical description of janks and how they are calculated, please refer to the last section of this page.
The FPS Stability Chart (and a note on testing apps)

Although FPS Stability is useful summary metric when expressed as a simple percentage, it can sometimes be more revealing when visualised as a full chart. This FPS Stability chart shows the percentage of session time spent (Y-axis) at each possible frame rate between 0fps and 60fps (X-axis).
In the example above, the FPS Stability chart reveals a gameplay experience that is fairly stable at 40fps, but it also tells us that the game has probably been capped at 60fps by the developer. We can see this from the way that the fps never reaches 60fps so may not be optimised for this device. We can also see the chart quickly falls to zero after 30fps – telling us that virtually no session time was spent at anything higher.
Note: Developers often employ such frame rate caps in games that don’t necessarily demand a 60fps experience, in order to limit their game’s impact on resource usage and battery life. The quickest way to spot such caps is using the FPS Stability chart.
The next illustrative example (below) shows two test sessions with the same median frame rate (27fps) but very different degrees of stability. In the less stable example, a large proportion of the test sessions ran at above 30 fps, but a large amount of time was also spent at less than 27fps, with drops down to 20-25fps occurring quite regularly. This latter session would be experienced as erratic and lacking in smoothness. The more stable session never exceeded 30fps (likely due to a frame rate cap), but would probably be perceived as being superior:


FPS Stability for apps
The FPS Stability chart paints a picture of a user experience that can be useful for evaluating apps as well as games. For example, most apps are designed to have just two states: static or moving. Static screens should generally target 0fps (because anything higher would be a waste of battery), while moving screens should target 60fps (in order to match the animation rate of the main iOS or Android UI to which app users have become accustomed). On an FPS Stability chart, this would like two distinct peaks: one at 0fps and one at 60fps. Any deviation from this shape might indicate a UX problem.
In the example below, taken from a clothing retail app, the FPS stability chart looks healthy. There is a small peak around 0fps and a much larger peak at 60fps – telling us that the user spent most of the session actively browsing, and when browsing they experienced smooth 60fps animation (for example, while they were scrolling). There is also a small peak at 30fps, representing time spent looking at “cat walk” video segments within the retail app:

Another retail app, which had a less smooth UX, showed a very different chart. It had no clear peak at 60fps, showing that scrolling rarely achieved this target (it usually maxed out at around 52fps instead). It also had an excessive peak at 0fps, reflecting too much time spent looking at a static screen:

Over time, it should be possible for a tester to define a healthy FPS chart for any real-world game or app session, including the positions and relative heights of peaks. This will make it relatively quick and easy to spot sessions where something went wrong.
Known issues
Missing screenshots – Some apps, such as certain banking apps and some DRM-protected video players, prevent GameBench from capturing screenshots.
Unexpected FPS readings – GameBench frame rates have been validated by our chip vendor partners using sophisticated techniques, such as high-speed cameras. However, we do know of some instances where GameBench records the frame rate of the wrong onscreen element. For example, on some iOS and Android video players, GameBench records the frame rate of the video player UI rather than the video window itself, resulting in a 60fps reading instead of the 24fps or 30fps reading one might expect from a video.
Inaccurate correlation with onscreen events – Due to the way different metrics are reported and calculated, the correlation between specific change in a metric and a screenshot is only accurate to within 1-2 seconds. If you’re analysing a short-lived event (e.g. only 1 second long) please look at the screenshots that are either side of this event, as well as the directly matched screenshot, in order to understand any correlation to onscreen activity.
Technical Details
What is a jank?
There is a ‘jank’ each time the ratio between ‘time to draw a frame’ and ‘the refresh period used by the device’ changes.
This can also be expressed as the following formula:

 = timestamp when the app started to draw the frame
 = timestamp immediately after the frame was submitted to the h/w
 = frame latency, the difference between
  and
and  , (
, (  =
=  -
-  )
) = device refresh period. It is the amount of time between every update of the display hardware’s buffer: a predefined constant representing the instant of time when the drawn frame can be shown to the user.
For instance, in a device with a refresh period of 16ms, if a frame is drawn in less than 16ms and the following frame is drawn in more than 16ms then there is a jank, because the Γ goes from 1 to 2 (the result of the division is 1 or 2 because it is rounded up to the nearest integer). If this happens a lot during an animation, the animation appears janky, even if it runs at 60 fps on average.