Network
What is Network Usage?
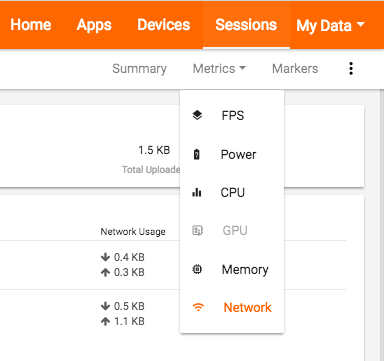
Nowadays, almost every app and game relies on an internet connection to provide a service, so network usage has become a key metric when evaluating performance. You can see the network usage of your test session by navigating to the session on the GameBench Web Dashboard and then clicking either of the Network Usage boxes on the Summary pane, or clicking Network via the Metrics pulldown menu (shown below).

When implemented badly, network usage can cause slowdowns, prolonged wait times, unexpected data plan usage, and excessive battery usage. When implemented well, good network usage can be a useful selling point or differentiator – for example, if you can show that your app is less data-hungry than a competitors, or that it downloads and buffers data in a more convenient manner (e.g. to permit a degree of offline use).
Tip: If you’re able to test your app in different network environments (e.g. areas with different signal strength), then GameBench’s Web Dashboard will provide a useful way of storing and comparing those tests.
What is displayed?

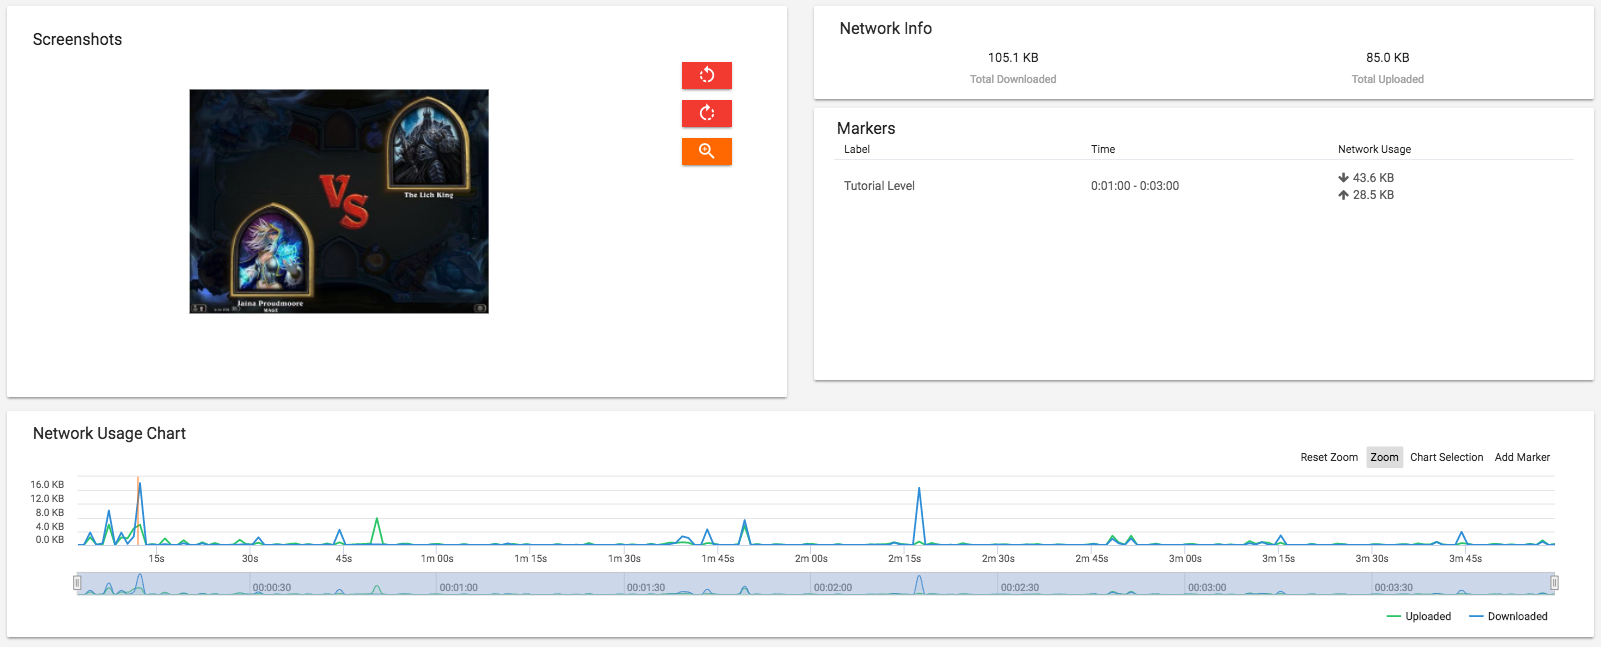
The Network Info box in the top-right of the Network pane displays the total amount of data uploaded and downloaded by both of the network interfaces on the mobile device (WiFi and Mobile Data/Cellular) during an entire session. These totals are shown kilobytes (KB) or megabytes (MB) because we are dealing with quantities of data rather than speed of data.
Below this is the Session Markers - Network box, which shows network usage between the points of any markers that have been set. (See Using Markers for more).
At the bottom of the Network pane, you have the App Network Usage chart showing Transfer Speed (Kbps) over Time (s). In other words, the height of the line represents the speed at which this data was transferred, and the size of the area under the line gives a rough sense of the number of kilobits (Kb) that were transferred (as opposed to the KB shown in the Network Info box). The colour of the line represents the direction of transfer (Blue = Upload, Orange = Download), and hovering over a particular point reveals that type of transfer (WiFi or Cellular).
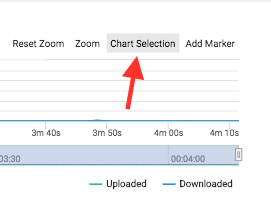
As with any GameBench chart, you can use the Chart Selection tool (revealed by hovering over the chart with your mouse, shown below) to highlight a particular region of interest and show network totals (in MB) as well as other key metrics for that region.

What should you look for?
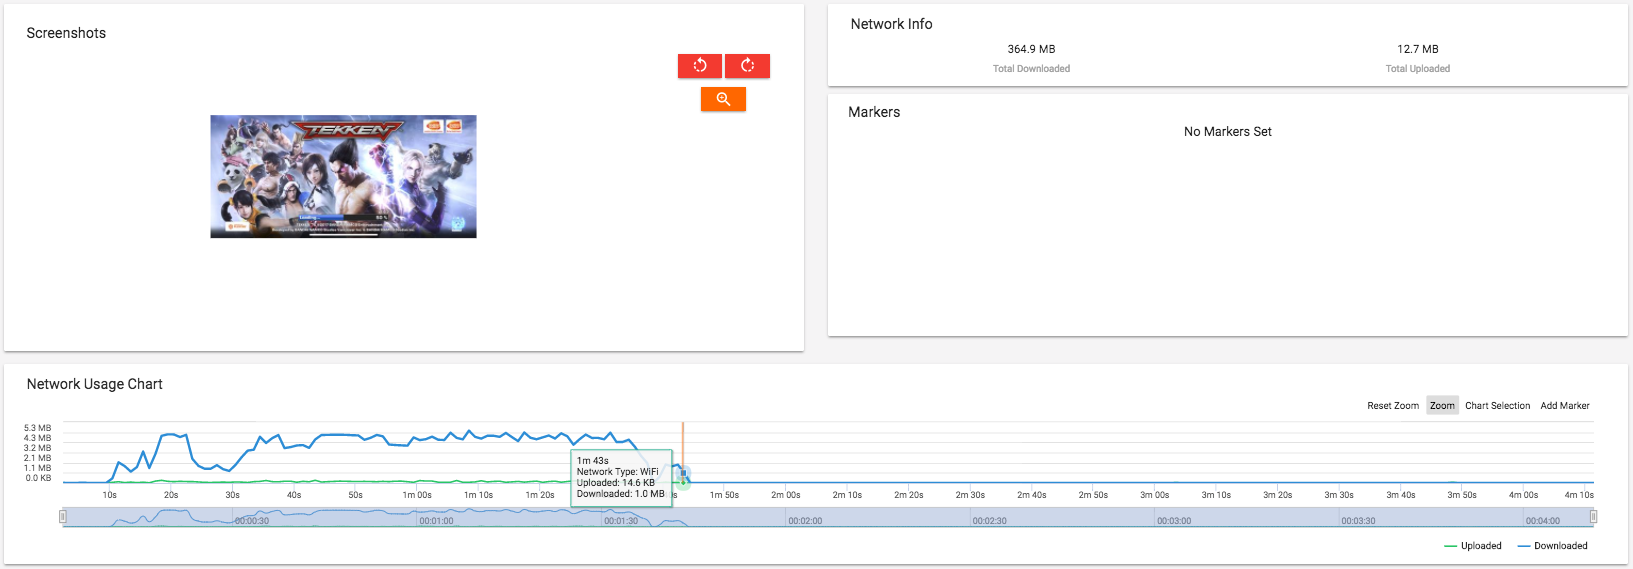
Look out for heavy bursts of fast data transfers right after the launch of an app or game, because it tends to be these initial bursts that cause excessive load times. It may sometimes better to transfer data in small, slow chunks, rather than big, fast ones, in order to avoid such user-perceived bottlenecks.
In the app below, for example, a large download caused the user to wait on the loading screen for approximately 90 seconds while their content loaded.

Using the wireless radio (whether WiFi or Cellular) to transfer data is potentially one of most significant sources of battery drain for an app. To minimize the battery drain associated with network activity check best practice for your targeted OS. If your application performs a lot of network operations, you should consider providing user settings that allow users to control your app’s data habits, such as how often your app syncs data, whether to perform uploads/downloads only when on Wi-Fi, whether to use data while roaming, and so on.
How is it measured?
-
Android - GameBench uses the standard Android Network API’s to retrieve the network usage information. More information can be found at this link.
-
iOS - Network usage is measured using the Activity Monitor Instrument.