Memory

The Memory pane is one of the simpler metrics reported by GameBench, but also one of the most critical. While there are many utilities for detecting crashes, the GameBench Memory pane predicts how close your app came to crashing for memory-related reasons, thereby allowing you optimise back towards safer limits even before a crash has been experienced.
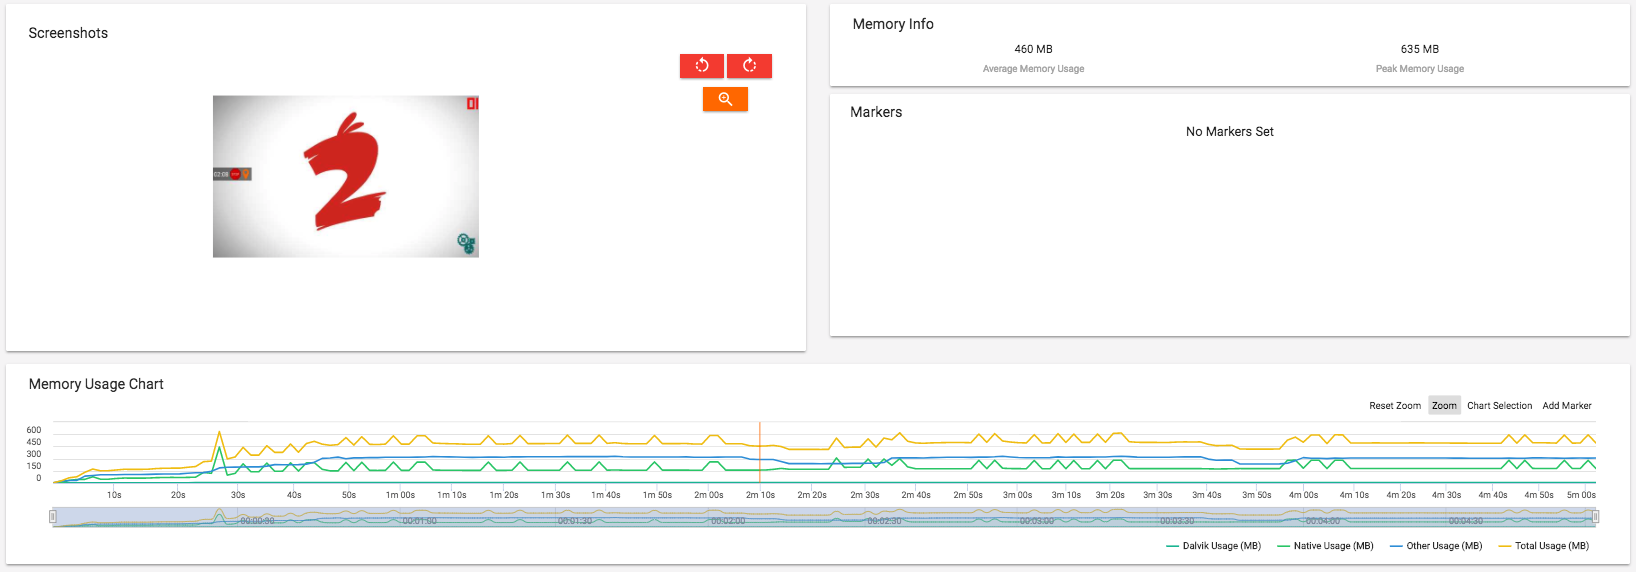
The Memory Info Box

The Memory Info box reveals mean average and peak memory usage for a session.
The Session Markers box

As with certain other metrics, you can use “in” and “out” markers to define a region of interest in a test session, and this box will display memory readings just for that region.
The Memory Usage Chart
Memory usage for Android devices (for Pro sessions)

The Android sessions which are recorded via the GameBench Pro tools, have the following memories categories:
- Java: Memory from objects allocated from Java or Kotlin code.
- Native: Memory from objects allocated from C or C++ code.Even if you’re not using C++ in your app, you might see some native memory used here because the Android framework uses native memory to handle various tasks on your behalf, such as when handling image assets and other graphics—even though the code you’ve written is in Java or Kotlin.
- Graphics: Memory used for graphics buffer queues to display pixels to the screen, including GL surfaces, GL textures, and so on. (Note that this is memory shared with the CPU, not dedicated GPU memory.)
- Total: Total memory used by the app (sum of the above three categories and a few more like Stack/Code and other system memory attributed to the profiled app)
Downloading the CSV output for a session will include the new Android memory metrics (if they have been recorded.) In order to retrieve the new memory metrics via the API, see the Android memory endpoint documentation.
The categories above were introduced in the following releases: Web Dashboard v1.11, Android Pro App v7.0, Desktop App v1.3
Memory usage for Android devices (for SDK sessions)

The Memory Usage chart displays the allocation of memory (in MB) to various usages (Total, Dalvik, Native, Other) over the duration of your test session.
- Dalvik: The proportional set size for Dalvik heap.
- Native: The proportional set size for the native heap
- Other: The proportional set size for everything else.
- Total: The sum of the above
Memory usage for iOS devices
 The iOS sessions have the following memories categories:
-
App Usage: Memory used by the tested app
-
Dalvik: The proportional set size for Dalvik heap.
-
Native: The proportional set size for the native heap
-
Other: The proportional set size for everything else.
-
Total: The sum of the above
Memory usage for iOS devices
 The iOS sessions have the following memories categories:
- App Usage: Memory used by the tested app
What should you look for?
While most iOS apps in our database use 100-200MB of RAM, and most Android apps use 200-500MB, we have examples of games that use over a gigabyte of memory – greatly increasing the chance that the app will fail or be force-closed by the operating system.
In general, your memory footprint should be proportionate to the amount of memory in the devices owned by your typical users. For example, if you have a casual game that is popular among people who have mid-range Android phones, then you should consider a target footprint of below 200MB (peak and average). But if you’re developing a high-end game, where most users have high-specced smartphones, you could permit a peak of 500MB – which would put your app in the top 20 percent of memory-hungry titles. Going beyond 800MB would be very risky, however, putting you in the top 2 percent.
We also have examples of leaky apps and games whose memory footprints grow constantly over time, without memory being properly cleaned, such that crashes become far more likely in longer sessions. A good memory chart will generally be one which reaches its peak part-way into the session and then stabilises for the remainder of the session.