GPU

Graphical Processing Unit (GPU) Usage is a useful predictor of user experience problems, particularly in games. If software is making excessive demands on graphical processing hardware, this can directly lead to noticeable problems like unstable frame rates, micro-stutters and high power consumption. One way to reduce these problems might be to reduce the GPU’s workload, for example by downgrading certain art assets in the game.
Conversely, if visual problems exist despite GPU Usage being consistently low, then this indicates an optimisation problem or bug – likely one that cannot (or should not) be fixed by downgrading art assets, but which may instead stem from the way the user interface is laid out, for example, or the way tasks are being apportioned across different computational resources (such as different CPU threads).
Unlike game developers, app developers may not have much direct control over GPU usage (which is often abstracted and taken care of by the OS). Nevertheless, testers and QA engineers in the app world may still find value in knowing the healthy threshold for GPU Usage of their product, in order to spot outliers and thereby predict problems with the quality of experience (such as lack of smoothness during scrolling).
The GPU Info Card

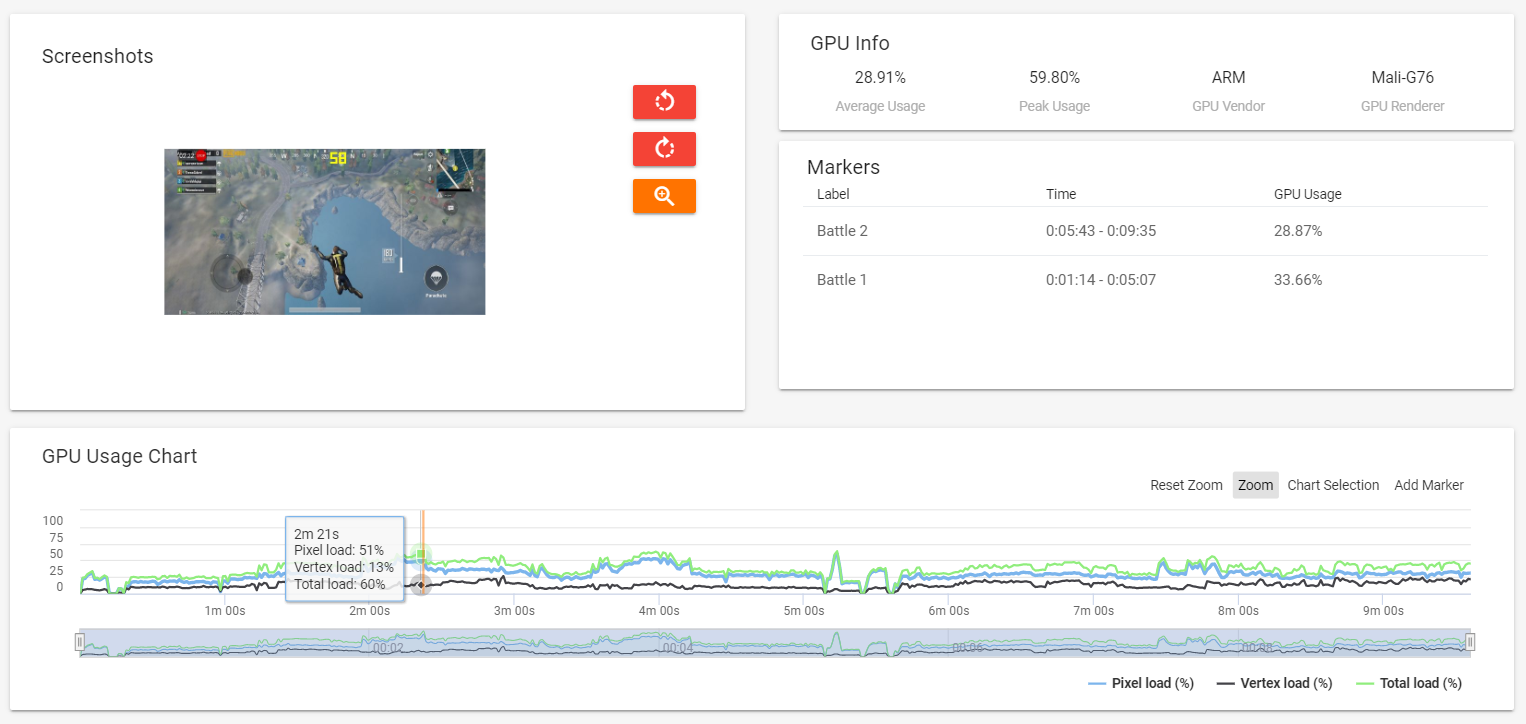
This box presents a quick session-wide summary of GPU usage, including the two most important top-level metrics:
Average GPU Usage – This is probably the most critical metric for predicting problems, since a high average usage means that the GPU has consistently had to work hard across the duration of a session. Many well-optimised casual games, such as Super Mario Run and Farm Heroes Super Saga show average GPU usage of below 30 percent on high-end devices. Only a minority of game sessions (less than one third) tested by the GameBench team show more than 60 percent average GPU usage, and less than a tenth of the sessions show more than 80 percent average GPU usage. Note that for devices where “GPU Total Usage” capturing is not available, GameBench Pro takes into average GPU load calculation a load with the greatest average usage value.
Peak GPU Usage – Exaggerated peaks and troughs are to be expected in any session. This is because workloads change significantly over the course of the user journey and also because GPU Usage is unnormalised – such that a peak in usage may cause GPU clock speed to rise, thereby causing a sudden dip in usage. However, if you observe prolonged bouts of heavy GPU usage (e.g. above 80 percent) combined with peaks of 100 percent, then this indicates that you may well be hitting the ceiling of what the GPU can muster. Note that for devices where “GPU Total Usage” capturing is not available, GameBench Pro takes into peak GPU load calculation a load with the greatest average usage value.
GPU Vendor – This reveals the maker of the GPU. Different makers reveal GPU statistics in slightly different ways. GPU comparisons are therefore most accurate when comparing different software loads on the same hardware, rather than the same loads on different devices with different GPUs (although the latter is still possible, just with reduced reliability).
GPU Renderer – This is the model name of the GPU.
The GPU Markers Card

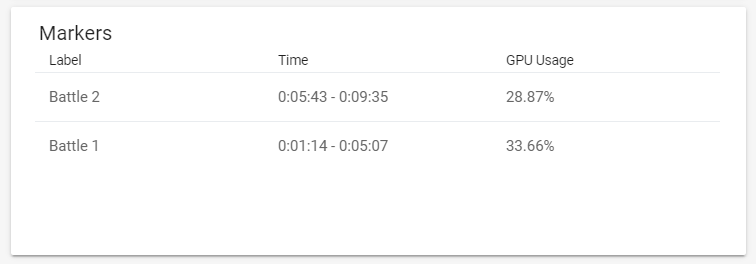
This card allows you to find average GPU usage in isolated gameplay regions such as battles or game levels. More information on GameBench Pro Markers.
The GPU Usage Chart

Viewing GPU Usage over time, while correlating with screenshots in the Screenshot box, will help you to identify which parts of the user journey pushed the GPU the hardest.
-
Vertex Load: Load in percent of the vertex processing hardware including vertex processing in the ALUs, work in the Tile Accelerator and related stall time.
-
Pixel Load: Load in percent of the pixel processing hardware including texturing, raster operation and fragment shader processing.
Technical notes and troubleshooting
GPU Usage can generally be assumed to represent the foreground app
GPU Usage values represent system-wide GPU utilisation. However, since the GPU is normally only used by apps running in the foreground, values reported can generally be attributed to the foreground app.