User Interface Overview
First Launch
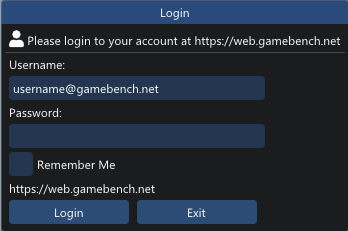
On the first launch of the GameBench ProNet Windows Tool it will display a popup like the one below asking for your GameBench web dashboard login details. Enter your user details and click ‘Remember Me’ to ensure the application does not ask for login details every time, then click ‘Login’
User Interface Overview
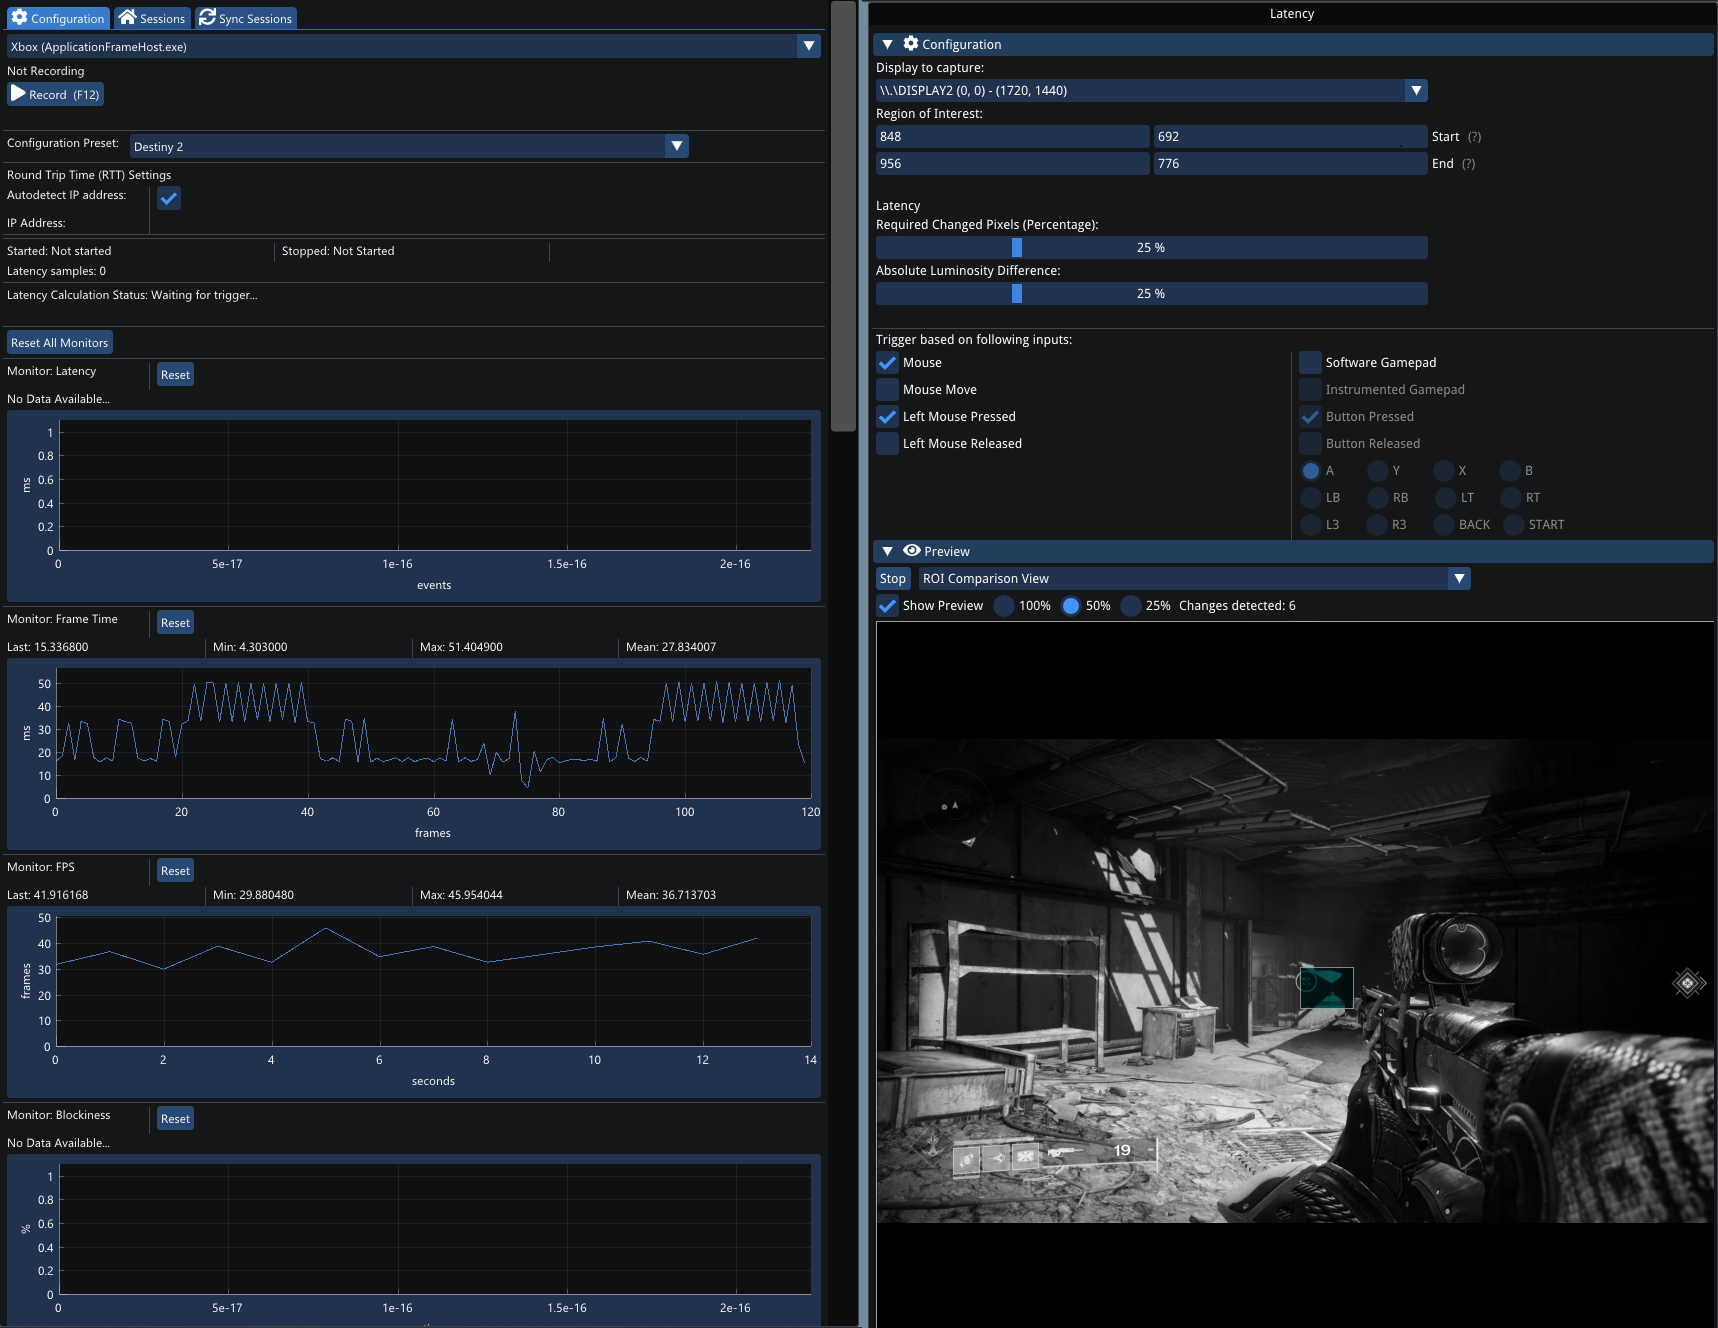
The User Interface consists of 2 main sections:
- Session configuration and results on the left
- Latency measurements setup on the right
Session configuration and results
The sessions window controls the recording of a session and also gives the live view of the results for both frame time statistics and latency results.
Session configuration

The top part of the session window allows a user to setup a session to record. The first step is to use the ‘Select Window’ dropdown to select the window you are measuring statistics for; this must be done before ‘Record’ can be pressed. The settings for Round Trip Time metrics can also be found here. There are 2 settings
- Autodetect IP Address: This will try and automatically determine the IP address of the server, by looking at the network data for the selected application/window.
- IP Address: This is the IP Address which will be used to determine the Round Trip Times and Jitter.
A preset dropdown is also provided which fills in the Round Trip Time settings and latency settings for a user. Simply click on the dropdown and select a new preset. New presets can be added by either configuring the settings to the desired values and selecting ‘Add New Preset…’ from the configuration preset dropdown; or a user can edit the config file found in ‘./Resources/config.json’
When a window is selected, Round Trip Time has been configured and latency configuration has been done (see Latency measurements setup ) ‘Record’ can be pressed. When a session is being recorded, frame time metrics and latency results are recorded and the number of latency samples captured is displayed in the session window. When a user wants to stop recording they just need to press ‘Stop’, the results will be automatically uploaded to the web dashboard for further analysis.
If the results do not automatically upload, a user can select the ‘Sync Sessions’ tab where a ‘Sync’** can be manually triggered.
Latency calculation status and live results
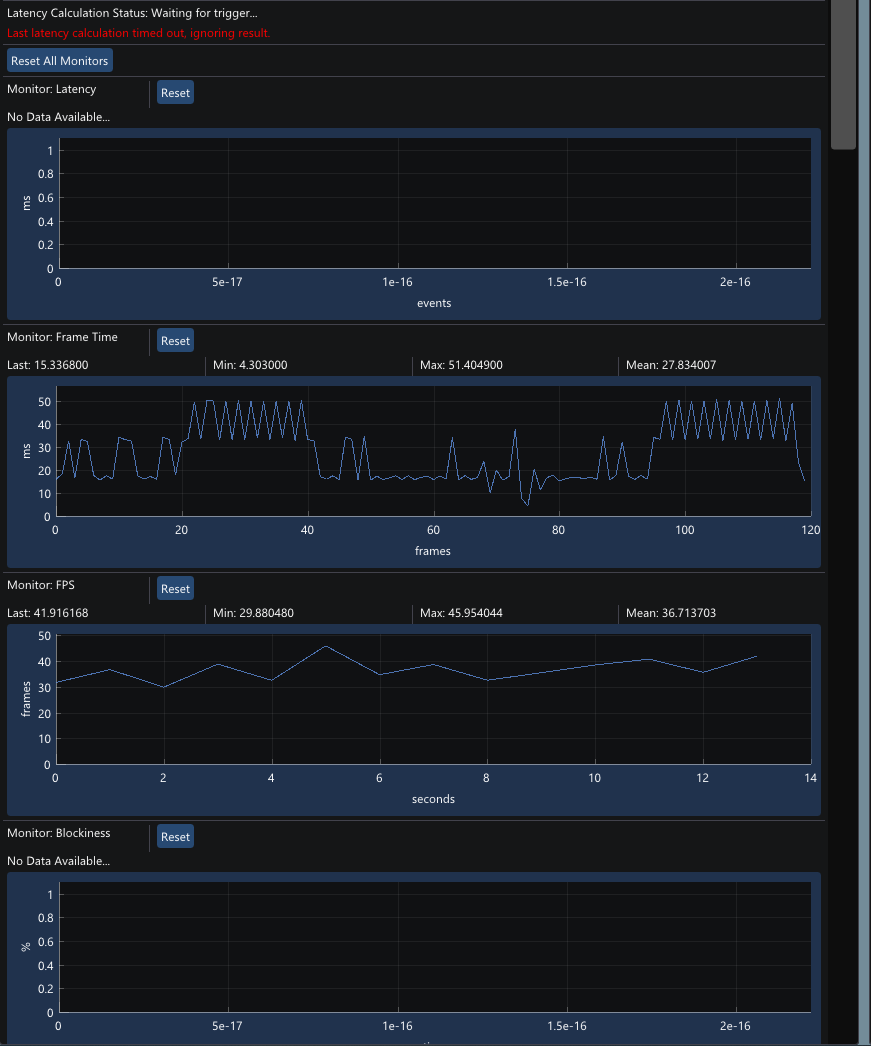
The second part of the session window shows the status of latency calculations as well as the results for;
- Latency measurements
- Frame times
- FPS measurements
- Application GPU and CPU usage
- Application RAM usage
- Server Round Trip Time and jitter
- Application download and upload data rates
The result graphs will update even if a user is not recording and can be used to ensure the tool is configured correctly before recording a session. However some graphs will not show any data unless the application has been selected from the ‘Select Window’ drop down. As well as the result graphs, the status of the current latency measurement is shown as well as any errors from the previous measurement. It indicates if it’s waiting for a ‘trigger’, i.e. mouse or gamepad button press, or if it’s received a trigger and is ‘calculating’ the latency result. If there is an error during the calculation the user will be prompted with one of 2 errors;

The calculation timed out. If the latency calculation fails to detect a ‘display event’ within a given number of frames on the output screen this error message will be displayed. If this happens, that latency result will be ignored and not recorded.
The last latency tool dropped/missed frames during the calculation. This means that the tool may have missed a frame when the ‘display event’ happened and as a result the measured latency may be higher than reality. This error message should be seen rarely, however if it is seen consistently it’s possible the PC specs do not meet the minimum requirements, or the screen refresh rate is too high.
Latency measurements setup
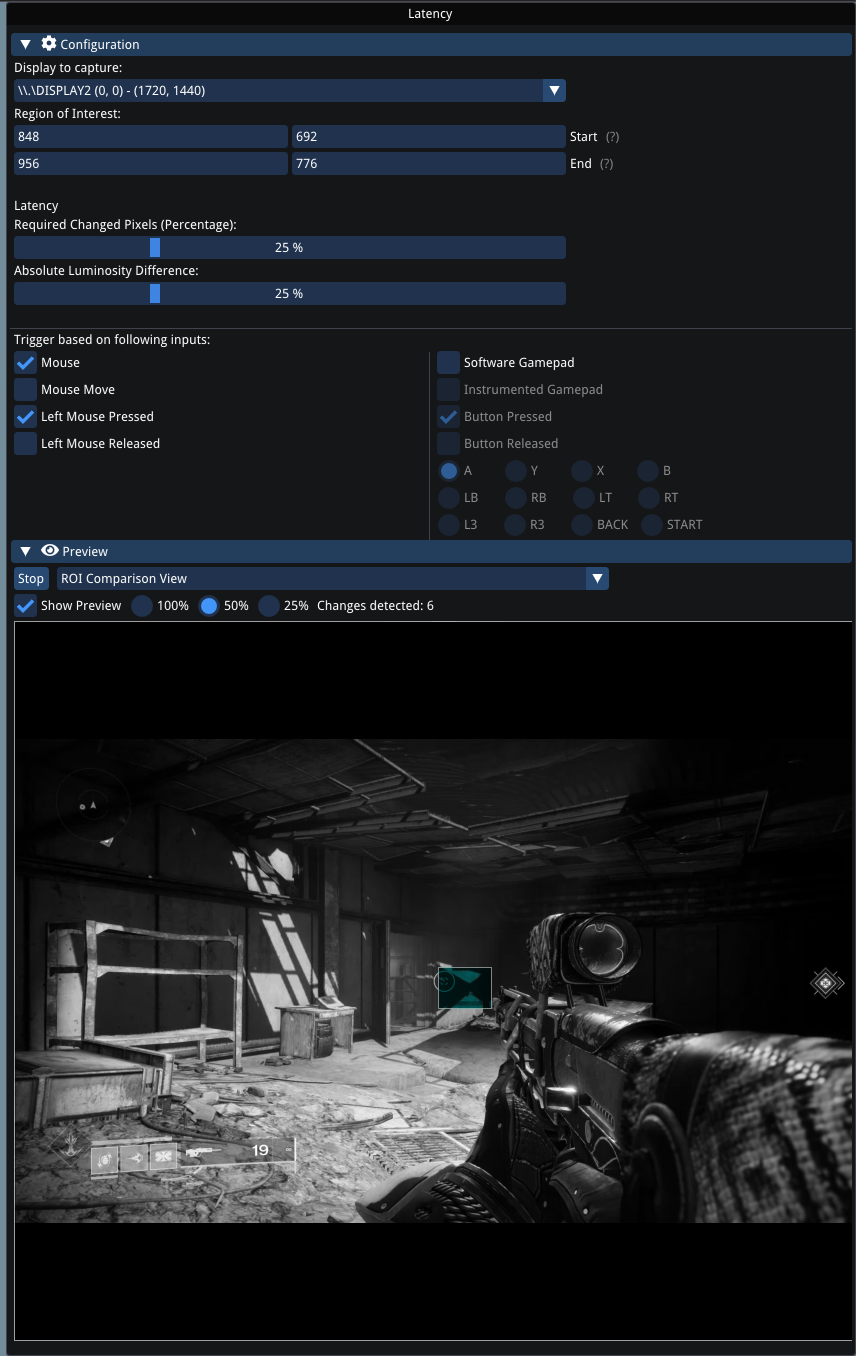
The latency window allows the user to configure how the latency input triggers are detected as well as how the corresponding in ‘display event’ is detected. There are 4 sections in the window
- Display and Region Of Interest (ROI) settings
- Latency ‘Display Event’ sensitivity for detection within the ROI.
- Trigger input settings to select what input device and button and start a latency calculation
- Preview view that displays what the tool is capturing, and also allows a user to draw the ROI on it.
Display and Region Of Interest (ROI) settings

The ‘Display to capture’ drop down allows the user to select which display/monitor the tool uses for analysing latency and frametime results. The display that is being captured can be seen in the preview window discussed in the ‘Preview view’ section.
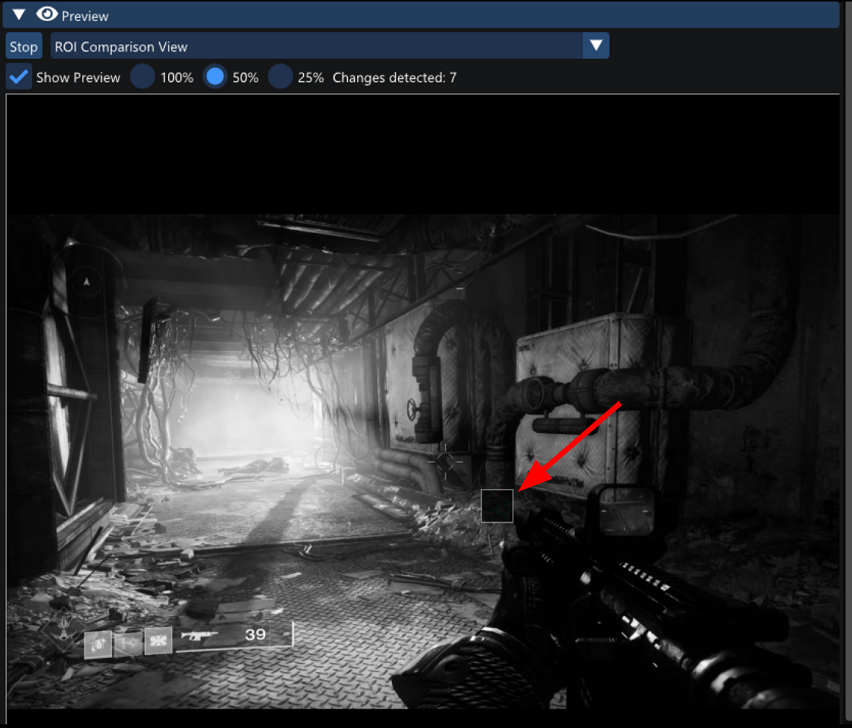
The ‘Region of Interest’ or ROI controls where on the display selected above the PC Latency Tool monitors changes on the screen which are used to determine the latency. The ROI can be entered manually here or drawn on the preview window as outlined in the ‘Preview view’ section.
It is very important to select a sensible ROI to ensure accurate results. It should be centred on the part of a screen that will show a distinct change when a button is pressed. This could be the muzzle flash at the end of a gun barrel or the brake light of a vehicle.
Latency sensitivity

The latency sensitivity, along with the ROI, are important settings to ensure accurate latency results. The sensitivity sliders control how much change is required within the ROI for the latency tool to detect a ‘Display event’. As a general rule you want to have the largest numbers possible without missing a latency result. GameBench advises that a user sets the ROI and using the default sensitivity settings tests a number of latency samples. If the latency results timeout or are inconsistent, then reduce the values in the sliders. If the sensitivity numbers are reduced too much then the tool may start detecting changes every frame meaning the latency results are much lower than they should be.
Trigger input settings

The trigger input settings allow the user to set what button(s) trigger a latency calculation. The current options are either mouse or gamepad. The default is left mouse button pressed, if you want to use a gamepad, select ‘Software Gamepad’ and then if it should trigger on button pressed or released, the exact button can also be chosen. The ‘Instrumented Gamepad’ can only be used with GameBench’s instrumented controllers; these provide greater accuracy on input timings but require additional hardware
Preview view
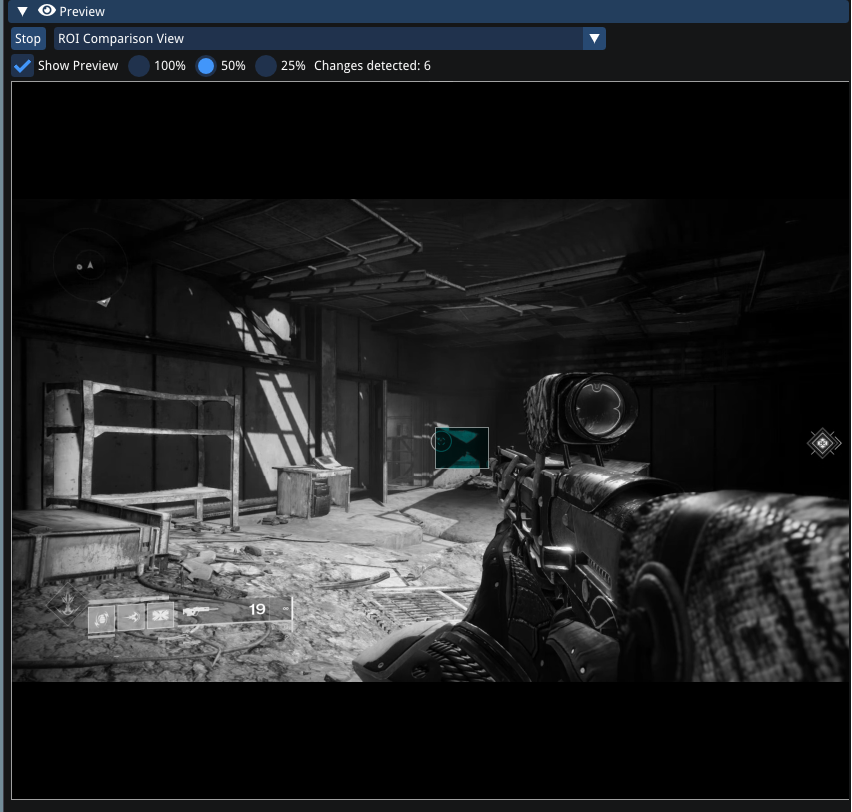
The preview window shows what the latency tool is currently analysing and can also be used to draw the ROI on the exact point on the image. The image below shows how a ROI box has been drawn in the preview view just above the gun muzzle indicated by the red arrow
Session Summary Window
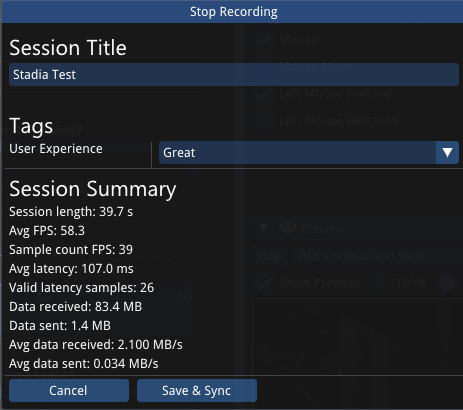
The session summary is displayed when the user stops a recording. This window has the following features
- Editable session title
- Selectable tag data
- Summary of the key session results
The session at this point can be discarded or saved using the buttons on the window. If the start/stop record shortcut button (F12) is pressed the session will be automatically saved, the session summary window will close and a new recording will begin.
Tag data
A session can be tagged with multiple values to help identify later or to add custom meta data. Tags can be easily added or removed by editing the ‘config’ file found in the resource folder.