Trends Explorer
The Trends Explorer lets you track performance metrics across multiple builds of your application, helping you spot regressions and improvements over time.
Overview
Access the Trends Explorer from the Trends link in the main navigation bar, or by clicking Investigate on a detected issue from the Dashboard Home.
Selecting an App
Use the App field at the top of the page to choose which application to analyse. The page shows the latest build info and session count for the selected app.
Filtering Builds
The Builds dropdown controls how many recent builds are included in the trend view:
- Last 5
- Last 10 (default)
- Last 20
- Last 50
Filters
The left sidebar provides filters to narrow which sessions are included in the analysis:
- Platform – Filter by Android or iOS.
- Devices – Filter by specific device models.
- Marker Group – Focus on a particular marker group across builds.
- Min Sessions/Build – Set a minimum number of sessions required per build to be included.
- Duration – Filter by session duration range.
- Date Range – Restrict to sessions recorded within a date range.
- Tags – Filter by session tags.
Quality Targets
Set optional quality targets to visualise pass/fail thresholds on the trend charts. For example, set FPS Median ≥ 30 to draw a target line on the FPS chart. Click Add Target to define additional thresholds.
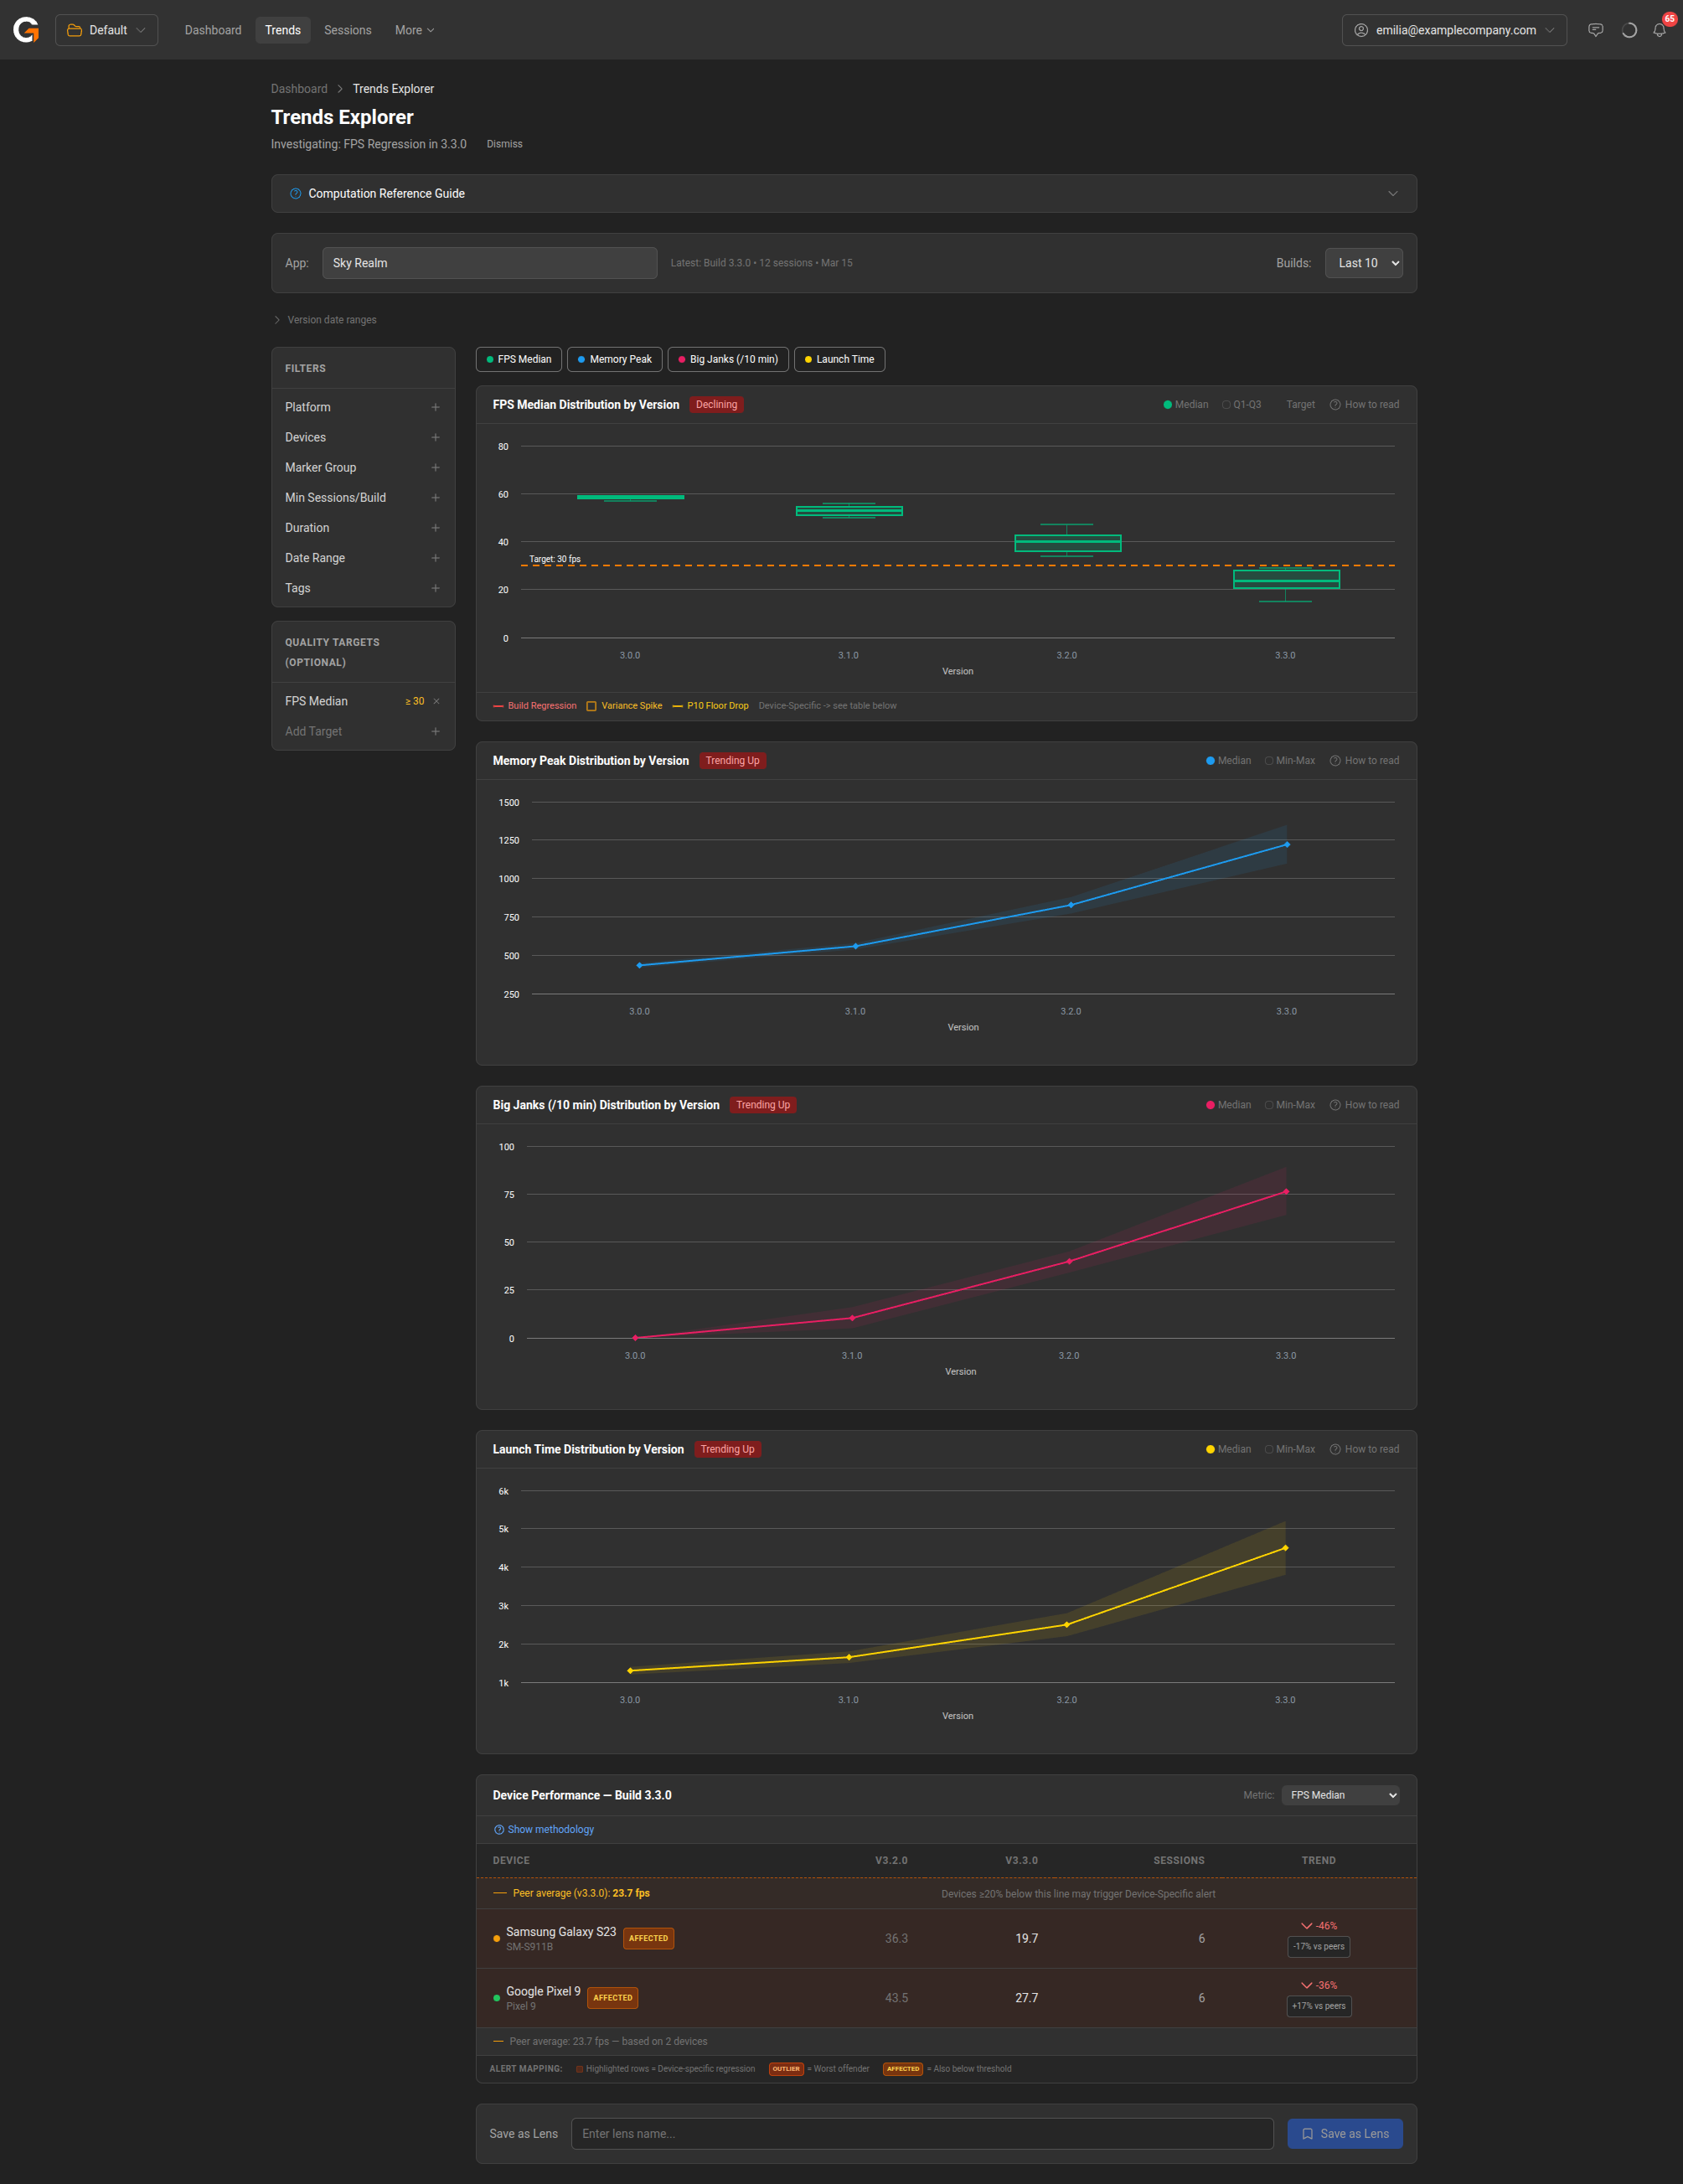
Metric Charts
The Trends Explorer displays distribution charts for key metrics across builds:
- FPS Median – Shows median and Q1-Q3 range per version, with trend status (e.g., “Declining”). Flags build regressions, variance spikes, and P10 floor drops.
- Memory Peak – Shows median and min-max memory usage per version.
- Big Janks (/10 min) – Tracks jank frequency across builds.
- Launch Time – Shows app launch time trends.
Each chart shows the metric distribution by version with a trend indicator (e.g., “Declining”, “Trending Up”).
Device Performance Table
Below the charts, the Device Performance table breaks down the selected metric by device for the latest build. It shows:
- Per-device metrics for the current and previous build.
- Session count per device.
- Trend percentage and comparison vs. peer average.
- AFFECTED and OUTLIER labels for devices with regressions.
Lenses
At the bottom of the page, you can save the current Trends Explorer configuration as a Lens. A lens captures your selected app, filters, quality targets, and metrics so you can return to the same view later. Saved lenses appear on the Dashboard Home.
Lenses also enable alerting — once saved, GameBench will automatically monitor your app against the filters and quality targets defined in the lens and surface any detected issues on the home page. This makes lenses the primary way to set up ongoing performance monitoring for your apps.