Trends Explorer
The Trends Explorer lets you track performance metrics across multiple builds of your application, helping you spot regressions and improvements over time.
Overview
Access the Trends Explorer from the Trends link in the main navigation bar, or by clicking Investigate on a detected issue from the Dashboard Home.
Selecting an App
Use the App field at the top of the page to choose which application to analyse. The page shows the latest build info and session count for the selected app.
Filtering Builds
The Builds dropdown controls how many recent builds are included in the trend view:
- Last 5
- Last 10 (default)
- Last 20
- Last 50
Filters
The left sidebar provides filters to narrow which sessions are included in the analysis:
- Platform – Filter by Android or iOS.
- Devices – Filter by specific device models.
- Marker Group – Focus on a particular marker group across builds.
- Min Sessions/Build – Set a minimum number of sessions required per build to be included.
- Duration – Filter by session duration range.
- Date Range – Restrict to sessions recorded within a date range.
- Tags – Filter by session tags.
Quality Targets
Set optional quality targets to visualise pass/fail thresholds on the trend charts. For example, set FPS Median ≥ 30 to draw a target line on the FPS chart. Click Add Target to define additional thresholds.
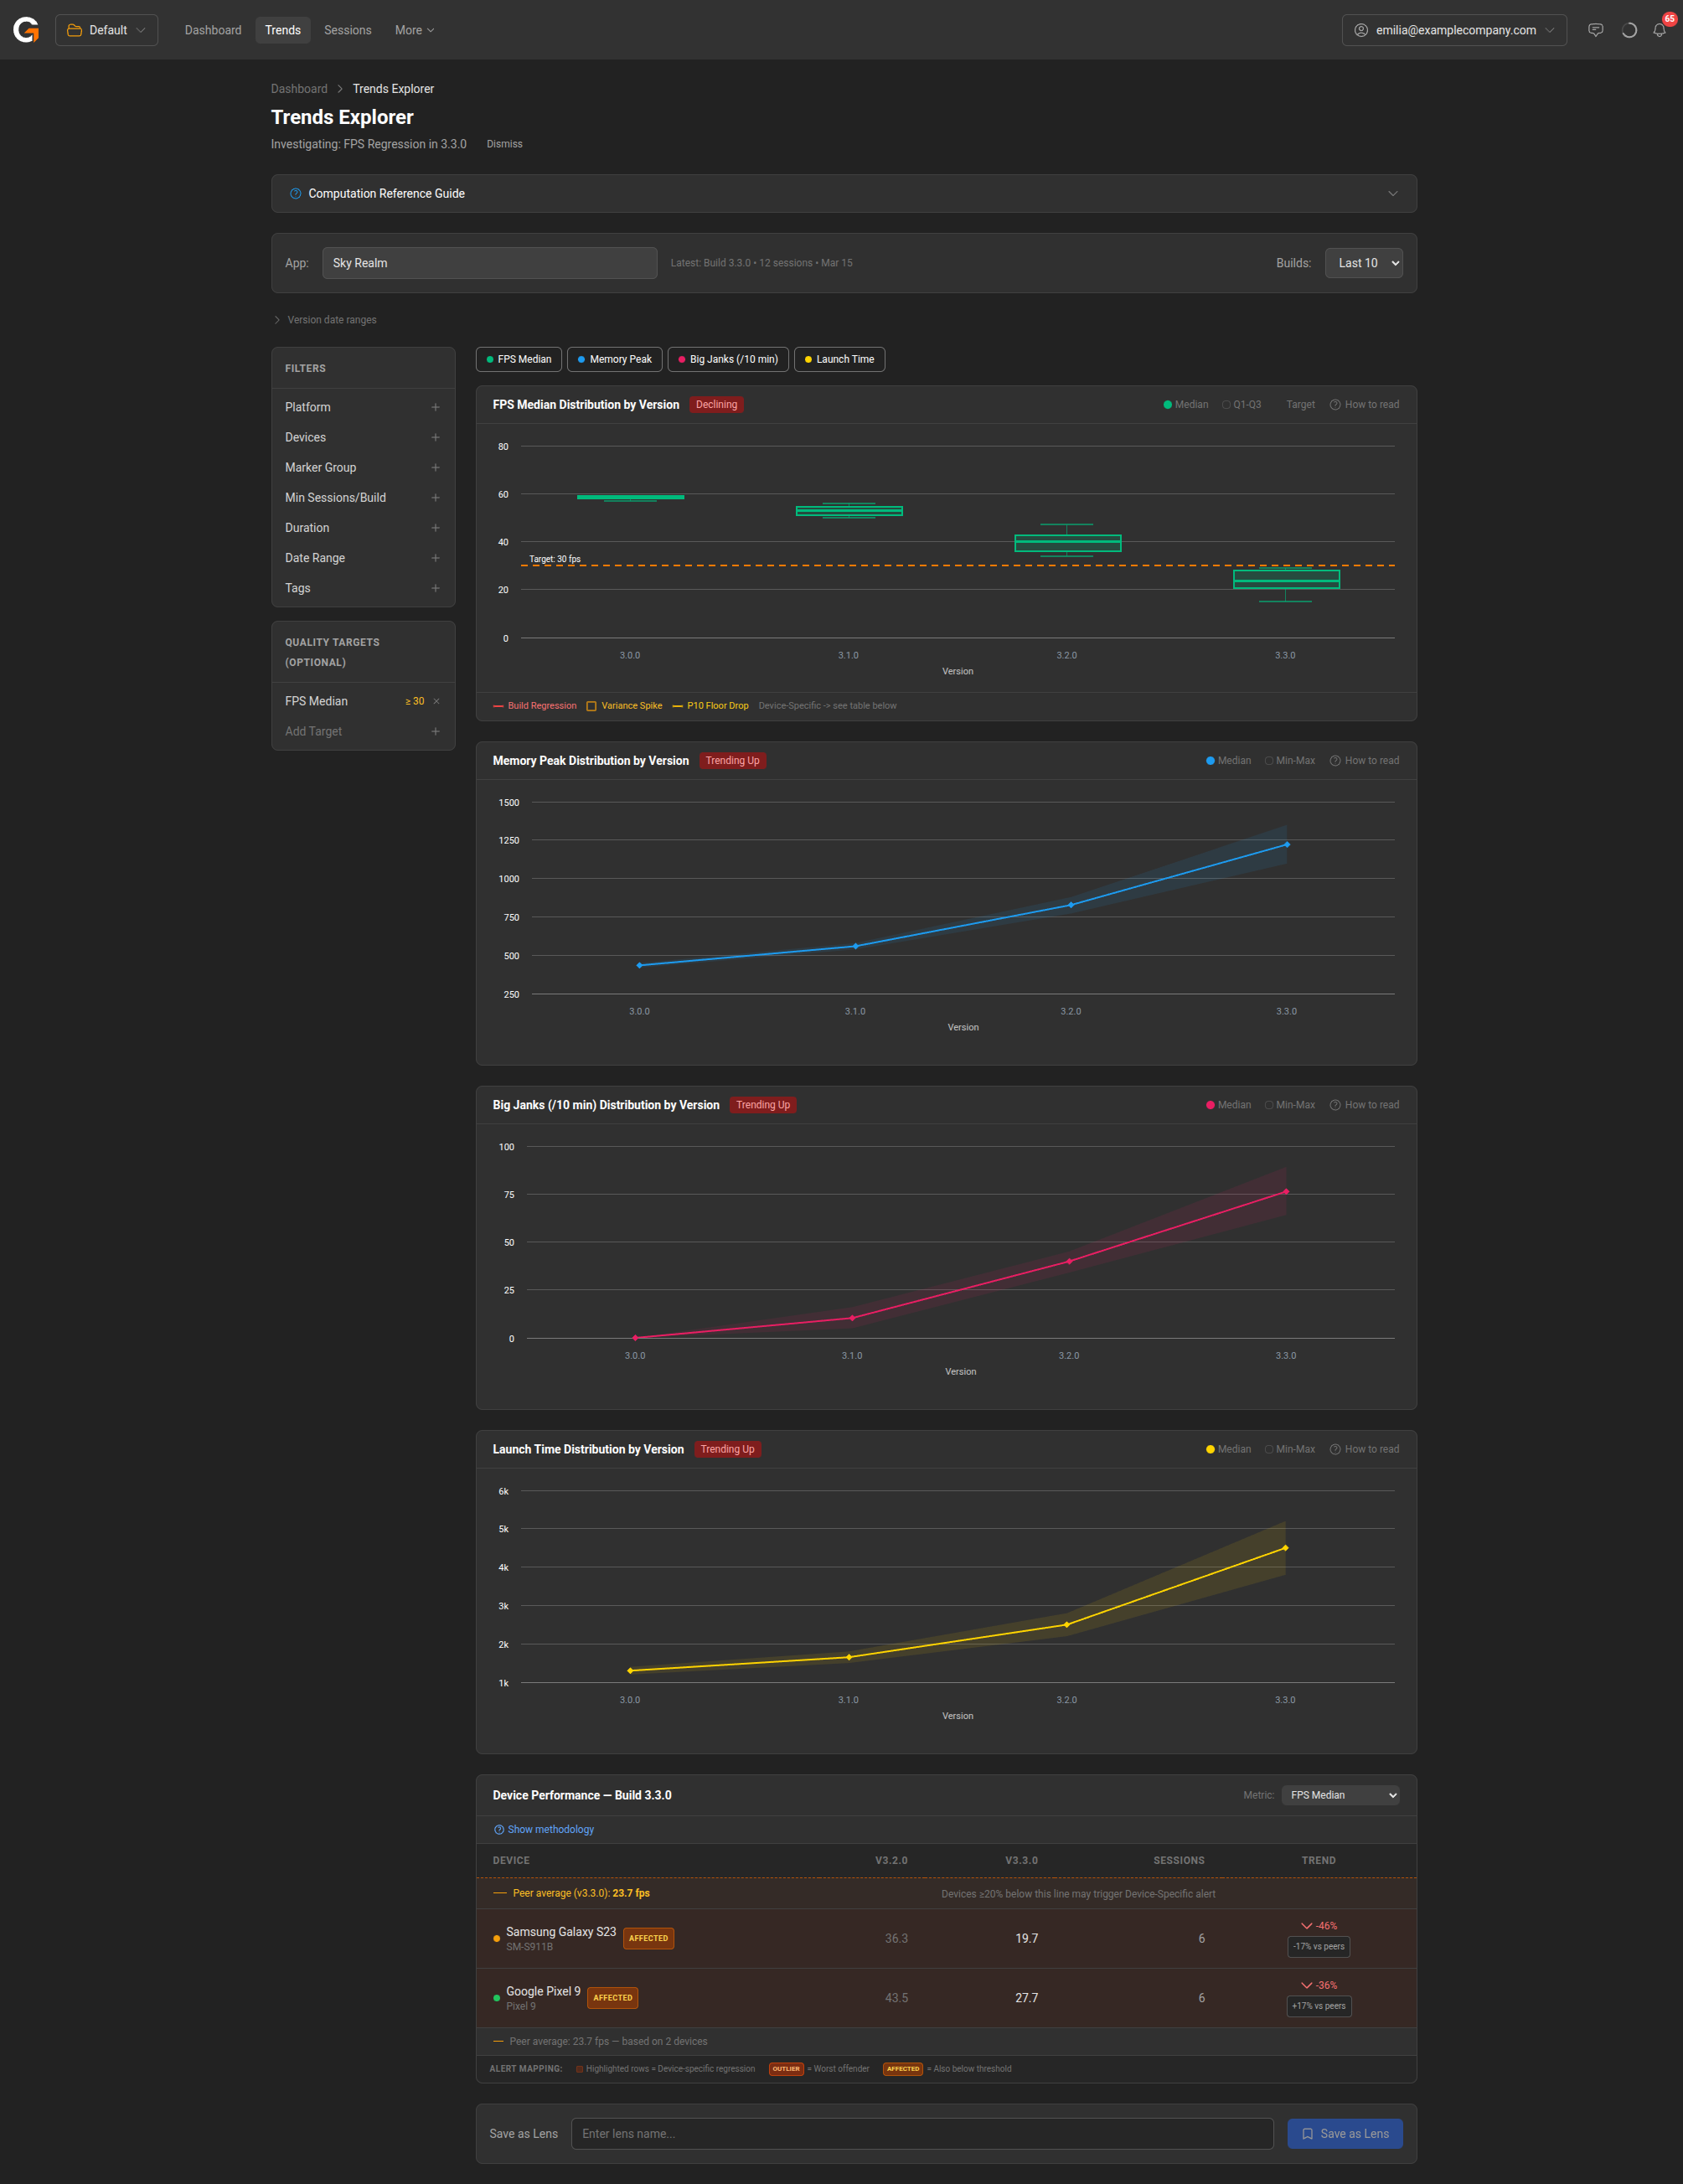
Metric Charts
The Trends Explorer displays distribution charts for key metrics across builds:
- FPS Median – Shows median and Q1-Q3 range per version, with trend status (e.g., “Declining”). Flags build regressions, variance spikes, and P10 floor drops.
- Memory Peak – Shows median and min-max memory usage per version.
- Big Janks (/10 min) – Tracks jank frequency across builds.
- Launch Time – Shows app launch time trends.
Each chart shows the metric distribution by version with a trend indicator (e.g., “Declining”, “Trending Up”).
Device Performance Table
Below the charts, the Device Performance table breaks down the selected metric by device for the latest build. It shows:
- Per-device metrics for the current and previous build.
- Session count per device.
- Trend percentage and comparison vs. peer average.
- AFFECTED and OUTLIER labels for devices with regressions.
Lenses
At the bottom of the page, you can save the current Trends Explorer configuration as a Lens. A lens captures your selected app, filters, quality targets, and metrics so you can return to the same view later. Saved lenses appear on the Dashboard Home.
Lenses also enable alerting — once saved, GameBench will automatically monitor your app against the filters and quality targets defined in the lens and surface any detected issues on the home page. This makes lenses the primary way to set up ongoing performance monitoring for your apps.
Issue Detection Alerts
Once a lens is saved, an Issue Detection Alerts panel appears in the left sidebar, beneath the Quality Targets section. When active, GameBench monitors the lens as new sessions arrive and sends a notification each time it detects a performance issue against your filters and quality targets.
To configure alerts for a lens:
- Open the saved lens in the Trends Explorer and expand the Issue Detection Alerts panel.
- Use the Add notification channel… field to attach one or more channels — the dropdown lists every channel defined for the active collection.
- Click Test Detection to run the detection logic on demand and confirm the channels receive a message. The button is disabled until at least one channel is attached.
- Remove a channel from the lens by clicking the × next to its name. This only detaches it from the lens; the channel itself remains available to other lenses.
The panel shows an Active badge whenever at least one channel is attached. Detected issues continue to appear in the Detected Issues section of the Dashboard Home regardless of channel configuration — channels control where notifications are delivered, not whether detection runs.
Managing notification channels
Notification channels are defined per collection and shared across all lenses in that collection. To add, edit, or remove channels, open Edit on the collection from the Dashboard Home and select the Notification Channels tab. Supported channel types:
- Email – Sends alert notifications to a specified email address.
- Slack – Posts to a Slack channel via an incoming webhook URL.
- Webhook – Sends a signed JSON payload to an arbitrary HTTPS endpoint for custom integrations. See Webhook payload below.
Webhook payload
When a Webhook channel fires, GameBench POSTs a JSON body to the configured URL with the following shape:
{
  "event": "issue_detection.alert",
  "timestamp": "2026-06-04T10:30:45.123Z",
  "lens": {
    "id": "4fd52f12-7e2d-447d-8fe5-fc1523cca6cd",
    "name": "Race Game"
  },
  "app": {
    "name": "Race Game",
    "packageName": "com.example.racegame"
  },
  "collectionId": "d74c101e-a46f-4b89-978c-78504acbc6e3",
  "issueCount": 2,
  "issues": [
    {
      "title": "FPS Regression",
      "description": "FPS Median dropped from 58.0 to 41.2 between v2.4.3 and v2.5.0",
      "severity": "critical",
      "severityLabel": "Critical"
    }
  ],
  "links": {
    "lens": "https://dashboard.gamebench.com/dashboard/trends?viewId=...&collectionId=...&companyId=..."
  }
}
Fields:
event– Alwaysissue_detection.alertfor real alerts, ortestfor payloads sent by the Test Detection button.timestamp– ISO 8601 timestamp when the alert fired.lens.id/lens.name– Identifies the lens that triggered the alert.app.name/app.packageName– The app whose sessions tripped the detection.collectionId– The collection the lens belongs to.issueCount– Length of theissuesarray.issues[]– One entry per detected problem:title– Short headline (e.g. “FPS Regression”, “P10 Floor Drop”).description– Human-readable detail including the affected metric and build comparison.severity– One ofcritical,warning,info, orrecovery.severityLabel– Title-cased version ofseverityfor display.
links.lens– A deep link back to the lens in the Trends Explorer.
Headers:
| Header | Value |
|---|---|
Content-Type |
application/json |
X-Timestamp |
Unix timestamp in seconds, e.g. 1717497045 |
X-Signature-256 |
sha256=<hex> — HMAC-SHA256 of <X-Timestamp>.<raw-body> using the channel’s shared secret |
To verify a request, recompute the HMAC as sha256_hmac(secret, timestamp + "." + body) and compare against X-Signature-256. Reject requests where the signature does not match or the timestamp is too old to mitigate replay attacks.
GameBench expects a 2xx response. Non-2xx responses are logged as a delivery failure for that channel and do not affect delivery to other channels on the same lens.