Metrics Timeline
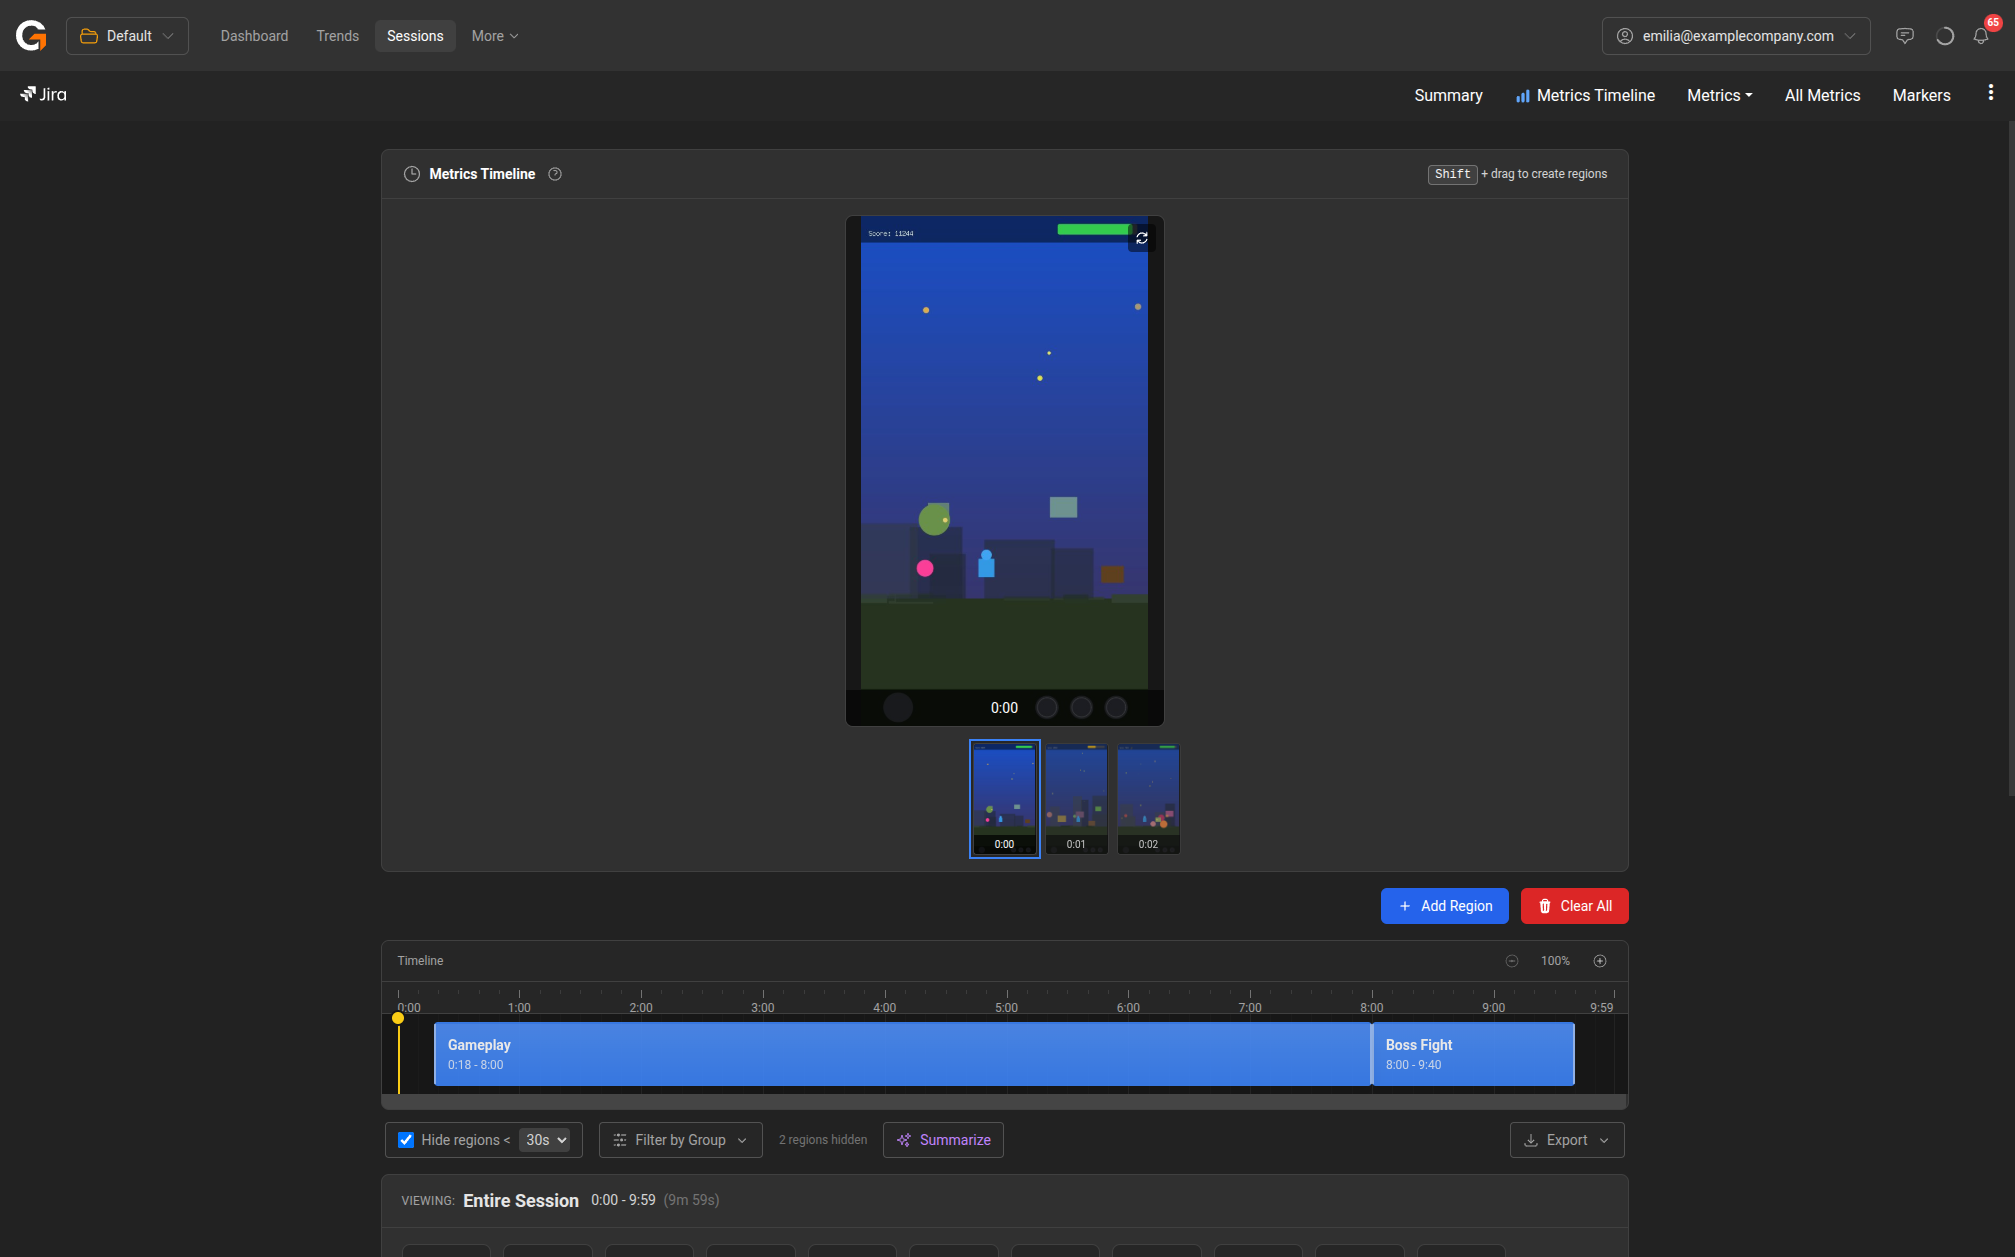
The Metrics Timeline provides an interactive view of your session’s performance data alongside timed screenshots, allowing you to correlate what was happening on screen with the metrics being recorded.
Screenshots
If screenshots were captured during the session, they appear at the top of the page. Click any thumbnail to view it full-size. Use the Rotate left/right buttons to adjust orientation, and the Switch to landscape mode button to toggle the display mode.
Screenshots are captured approximately once per second and provide visual context for understanding metric changes — for example, identifying whether a frame rate drop coincided with a particular gameplay moment.
Timeline
The timeline bar shows the full session duration with any defined regions highlighted. You can:
- Shift + drag on the timeline to create a new region for focused analysis.
- Zoom in/out using the zoom controls to examine specific time periods in detail.
- Click on a region to select it and view its metrics in the summary below.
Regions
Regions are named segments of the session (e.g., “Gameplay”, “Boss Fight”) that let you isolate and compare performance within specific parts of the session. The timeline displays regions as coloured blocks.
- Click Add Region to create a new region manually.
- Click Clear All to remove all regions.
- Use Filter by Group to show/hide regions by their group.
- The Hide regions checkbox with a duration threshold (2s, 5s, 10s, 30s, 60s) automatically hides regions shorter than the selected duration.
Session Metrics Summary
Below the timeline, the Viewing section shows aggregated metrics for the currently selected region (or the entire session if no region is selected). Metrics include:
| Metric | Description |
|---|---|
| FPS (Median) | Median frame rate with min-max range |
| FPS Stability | Percentage of time within ±20% of median |
| FPS Variability | Average variance between consecutive readings |
| 1% Low FPS | Bottom 1st percentile frame rate |
| Frame Time (95th %) | 95th percentile frame time in milliseconds |
| Big Janks (/10 min) | Significant frame time spikes per 10 minutes |
| CPU (Avg) | Average CPU usage with min-max range |
| GPU (Avg) | Average GPU usage with min-max range |
| Memory (Avg) | Average memory usage with peak |
| Network In/Out | Total data downloaded and uploaded |
Metrics Over Time Chart
The chart displays metric data over the session duration. Use the dropdowns to select:
- Primary metric — the main metric shown (e.g., FPS, Frame Time, CPU, GPU, Memory, Network, Battery).
- Compare with — an optional second metric overlaid for comparison.
Click Duplicate chart to add another chart below with a different metric selection. Use Add Metric Chart or Add Frame Time Chart at the bottom to add more visualisations.
Actions
- Summarize — Generate a summary of metrics across all regions.
- Export — Export the timeline data.