Session Detail
When you click on a session in the Sessions list, the session detail view opens with in-depth performance data. The detail view is organised into several tabs, each covering a different aspect of the session.
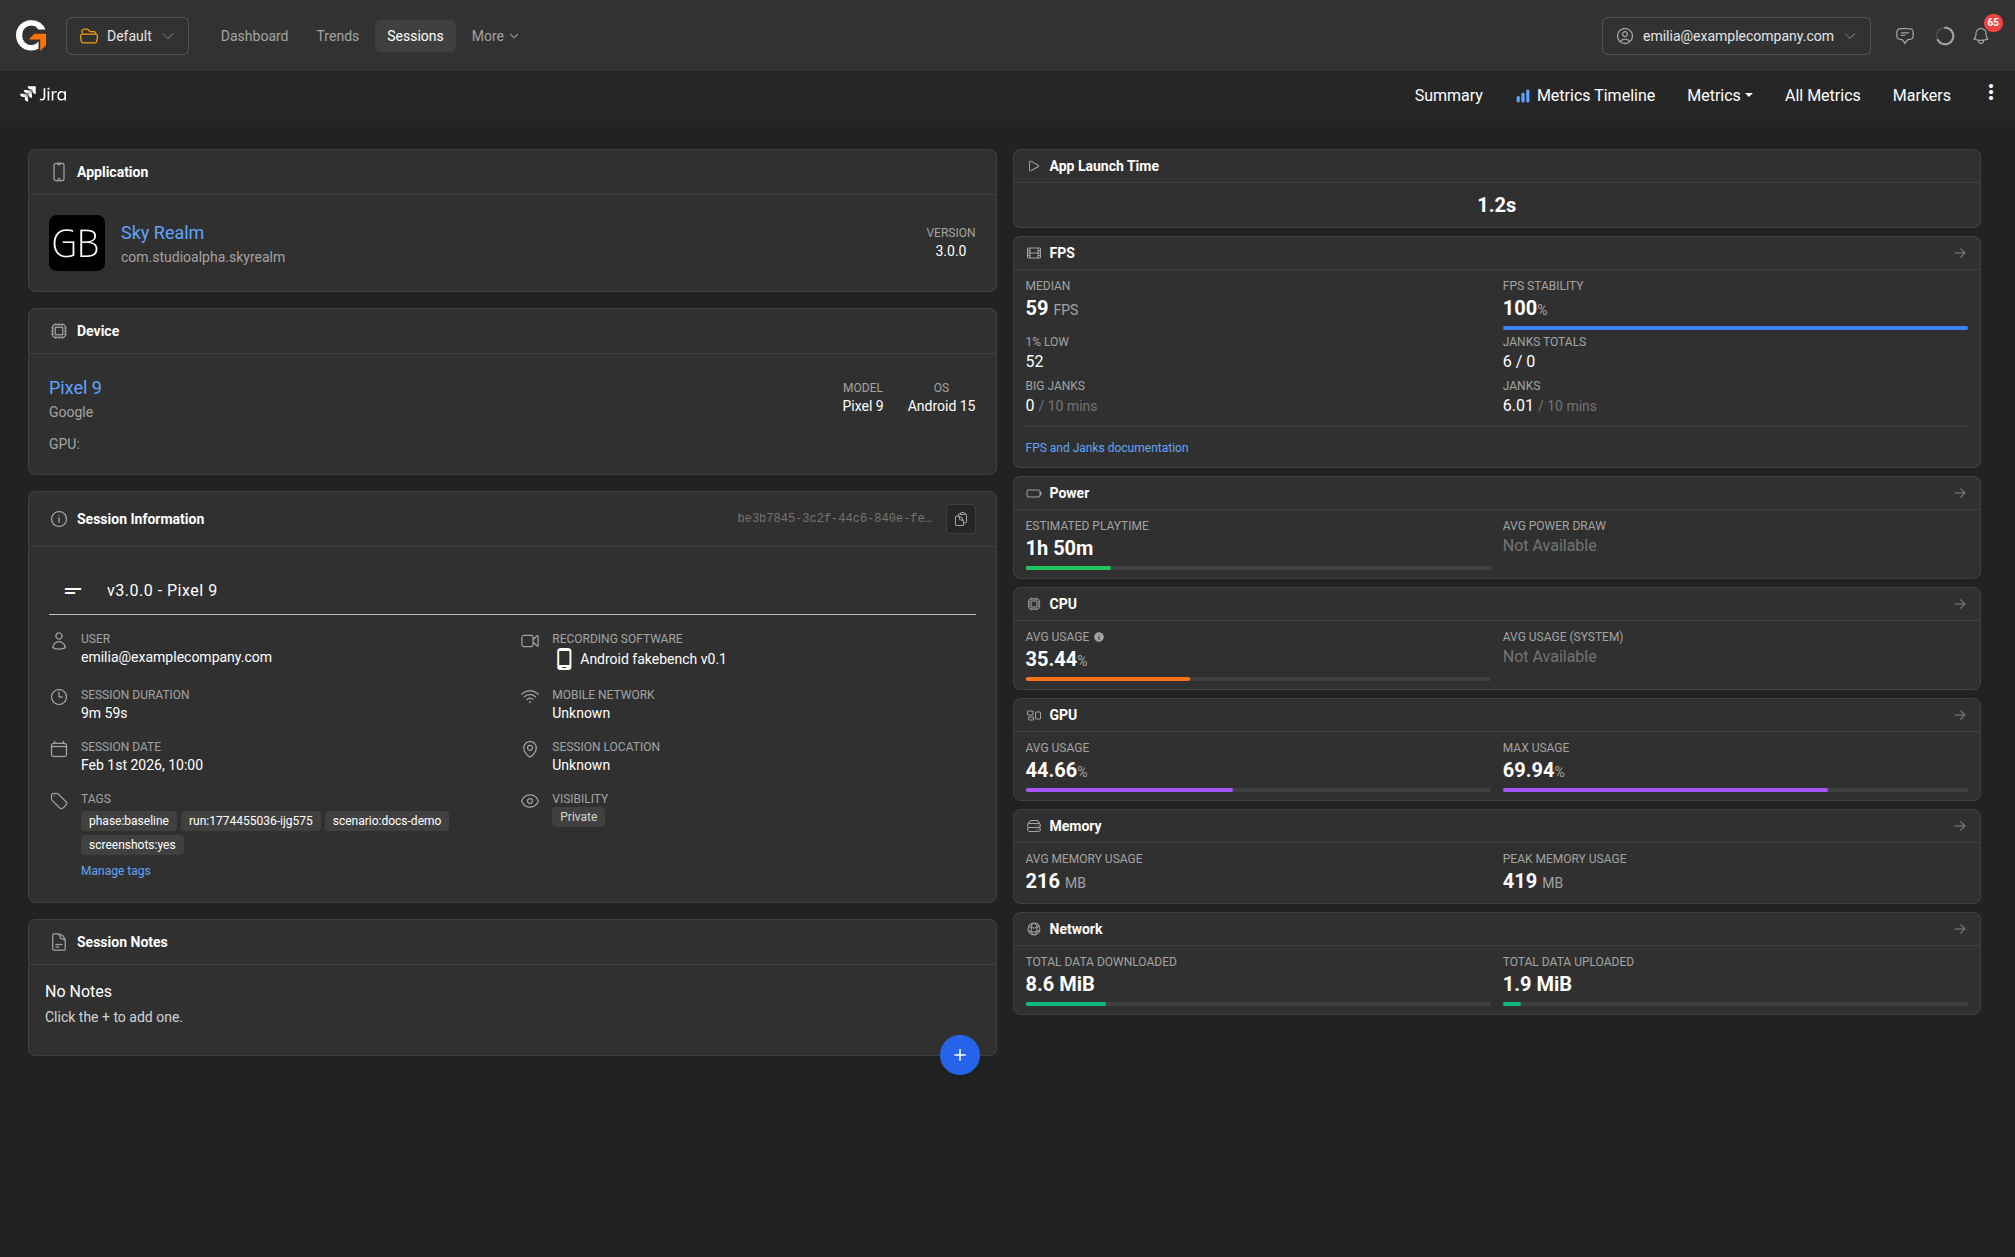
The session detail navigation bar provides access to:
- Summary – Overview of app, device, session info, and scorecard metrics (FPS, Power, CPU, GPU, Memory, Network).
- Metrics Timeline – Interactive timeline with screenshots, regions, and metrics over time. Shift+drag to create regions for focused analysis.
- Metrics – Detailed view of individual metric categories (FPS, Power, CPU, GPU, Memory, Network, Latency) with charts and marker breakdowns.
- All Metrics – All metric charts displayed together with toggleable categories.
- Markers – Summary and per-marker breakdown of all performance metrics.
Last updated on